CI/CD Contracts in Glasgow

CI/CD
Scotland > Glasgow

The table below provides summary statistics for contract job vacancies advertised in Glasgow requiring CI/CD skills. It includes a benchmarking guide to the contractor rates offered in vacancies that cited CI/CD over the 6 months leading up to 1 May 2025, comparing them to the same period in the previous two years.

6 months to
1 May 2025
Same period 2024 Same period 2023
Rank 20 22 18
Rank change year-on-year +2 -4 -1
Contract jobs citing CI/CD 88 73 88
As % of all contract jobs advertised in Glasgow 11.03% 8.32% 9.63%
As % of the Processes & Methodologies category 11.78% 9.06% 10.21%
Number of daily rates quoted 62 53 70
10th Percentile £350 £400 £410
25th Percentile £406 £438 £461
Median daily rate (50th Percentile) £469 £500 £640
Median % change year-on-year -6.25% -21.88% +21.90%
75th Percentile £525 £575 £712
90th Percentile £611 £675 £750
Scotland median daily rate £483 £500 £488
% change year-on-year -3.50% +2.56% -7.14%
Number of hourly rates quoted 0 0 1
Median hourly rate - - £60.55
Scotland median hourly rate £27.35 £60.50 £65.28
% change year-on-year -54.79% -7.32% +31.76%

All Process and Methodology Skills
Glasgow

CI/CD falls under the Processes and Methodologies category. For comparison with the information above, the following table provides summary statistics for all contract job vacancies requiring process or methodology skills in Glasgow.

Contract vacancies with a requirement for process or methodology skills 747 806 862
As % of all contract IT jobs advertised in Glasgow 93.61% 91.90% 94.31%
Number of daily rates quoted 478 515 629
10th Percentile £311 £280 £325
25th Percentile £393 £400 £410
Median daily rate (50th Percentile) £463 £475 £475
Median % change year-on-year -2.63% - +5.56%
75th Percentile £550 £588 £600
90th Percentile £603 £675 £701
Scotland median daily rate £463 £475 £475
% change year-on-year -2.63% - +2.15%
Number of hourly rates quoted 9 40 27
10th Percentile £16.18 £13.75 -
25th Percentile £16.75 £16.00 £10.63
Median hourly rate £19.83 £21.13 £13.50
Median % change year-on-year -6.14% +56.50% -66.24%
75th Percentile £65.00 £44.14 £35.00
90th Percentile £76.83 £63.75 £59.47
Scotland median hourly rate £21.59 £19.34 £17.72
% change year-on-year +11.66% +9.11% -55.69%

CI/CD
Job Vacancy Trend in Glasgow

Job postings citing CI/CD as a proportion of all IT jobs advertised in Glasgow.
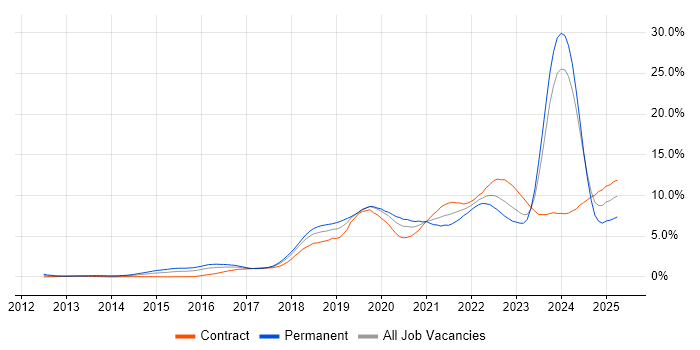
Job vacancy trend for CI/CD in Glasgow

CI/CD
Contractor Daily Rate Trend in Glasgow

3-month moving average daily rate quoted in jobs citing CI/CD in Glasgow.

Daily rate trend for CI/CD in Glasgow

CI/CD
Daily Rate Histogram in Glasgow

Daily rate distribution for jobs citing CI/CD in Glasgow over the 6 months to 1 May 2025.

Daily rate histogram for CI/CD in Glasgow

CI/CD
Contractor Hourly Rate Trend in Glasgow

3-month moving average hourly rates quoted in jobs citing CI/CD in Glasgow.

Hourly rate trend for CI/CD in Glasgow

CI/CD
Co-occurring Skills and Capabilities in Glasgow by Category

The follow tables expand on the table above by listing co-occurrences grouped by category. The same employment type, locality and period is covered with up to 20 co-occurrences shown in each of the following categories:

Application Platforms
1 1 (1.14%) Apache
1 1 (1.14%) Apache Airflow
Applications
1 1 (1.14%) Adobe XD
1 1 (1.14%) Sketch
Cloud Services
1 39 (44.32%) AWS
2 32 (36.36%) Azure
3 17 (19.32%) OpenShift
4 14 (15.91%) Amazon S3
5 12 (13.64%) Cloud Computing
6 7 (7.95%) GitHub
7 6 (6.82%) Amazon EKS
7 6 (6.82%) Cohesity
8 5 (5.68%) Azure Synapse Analytics
9 4 (4.55%) Azure AKS
10 3 (3.41%) Azure Cosmos DB
10 3 (3.41%) BlazeMeter
10 3 (3.41%) Dynamics 365
10 3 (3.41%) Power Platform
11 2 (2.27%) Amazon ECS
11 2 (2.27%) AWS Lambda
11 2 (2.27%) Azure DevOps
11 2 (2.27%) GCP
11 2 (2.27%) PaaS
11 2 (2.27%) Serverless
Communications & Networking
1 11 (12.50%) NAS
1 11 (12.50%) SAN
2 4 (4.55%) Network Security
2 4 (4.55%) VPN
3 1 (1.14%) Firewall
3 1 (1.14%) FTP
3 1 (1.14%) SSL
Database & Business Intelligence
1 7 (7.95%) Relational Database
2 6 (6.82%) NoSQL
3 5 (5.68%) MongoDB
3 5 (5.68%) SQL Server
4 4 (4.55%) MariaDB
4 4 (4.55%) MySQL
5 3 (3.41%) Amazon RDS
5 3 (3.41%) Apache Cassandra
5 3 (3.41%) RDBMS
6 2 (2.27%) Amazon Aurora
6 2 (2.27%) Neo4j
7 1 (1.14%) Amazon Redshift
7 1 (1.14%) Data Warehouse
7 1 (1.14%) Elasticsearch
7 1 (1.14%) Hadoop
7 1 (1.14%) Oracle Database
7 1 (1.14%) SQLite
Development Applications
1 26 (29.55%) Git
2 22 (25.00%) Jenkins
3 5 (5.68%) JUnit
4 4 (4.55%) Bitbucket
4 4 (4.55%) GitLab
5 3 (3.41%) Mockito
5 3 (3.41%) webpack
5 3 (3.41%) Xcode
6 2 (2.27%) Cucumber
7 1 (1.14%) Gatling
7 1 (1.14%) Gradle
7 1 (1.14%) JIRA
7 1 (1.14%) JMeter
7 1 (1.14%) Maven
7 1 (1.14%) SonarQube
7 1 (1.14%) Toad
General
1 25 (28.41%) Social Skills
2 20 (22.73%) Analytical Skills
2 20 (22.73%) Finance
3 13 (14.77%) Public Sector
4 10 (11.36%) Banking
5 6 (6.82%) Financial Institution
6 5 (5.68%) Organisational Skills
7 4 (4.55%) Back Office
7 4 (4.55%) Investment Banking
8 3 (3.41%) Inclusion and Diversity
8 3 (3.41%) Legal
9 1 (1.14%) Pharmaceutical
Job Titles
1 37 (42.05%) Developer
2 21 (23.86%) Java Developer
3 10 (11.36%) Python Engineer
4 8 (9.09%) Data Engineer
4 8 (9.09%) Python Developer
5 6 (6.82%) Architect
5 6 (6.82%) Front-End Developer (Client-Side Developer)
6 5 (5.68%) DevOps Engineer
6 5 (5.68%) Full-Stack Developer
6 5 (5.68%) Full-Stack Java Developer
7 4 (4.55%) Azure Data Engineer
7 4 (4.55%) Azure Engineer
7 4 (4.55%) Senior
8 3 (3.41%) Applications Developer
8 3 (3.41%) Data Architect
8 3 (3.41%) Infrastructure Engineer
8 3 (3.41%) Lead
8 3 (3.41%) Mobile Engineer
8 3 (3.41%) NetBackup Engineer
8 3 (3.41%) React Developer
Libraries, Frameworks & Software Standards
1 24 (27.27%) Spring
2 21 (23.86%) Spring Boot
3 10 (11.36%) CSS
3 10 (11.36%) React
4 9 (10.23%) Node.js
5 7 (7.95%) HTML
5 7 (7.95%) PySpark
6 6 (6.82%) AngularJS
7 5 (5.68%) RESTful
8 4 (4.55%) REST
9 3 (3.41%) CSS3
9 3 (3.41%) Express.js
9 3 (3.41%) FastAPI
9 3 (3.41%) HTML5
9 3 (3.41%) Loki
9 3 (3.41%) Middleware
9 3 (3.41%) pytest
9 3 (3.41%) Redux
9 3 (3.41%) SwiftUI
9 3 (3.41%) UIKit
Miscellaneous
1 7 (7.95%) Algorithms
2 5 (5.68%) Virtual Team
3 4 (4.55%) Legacy Systems
3 4 (4.55%) Linux Command Line
3 4 (4.55%) Mainframe
4 3 (3.41%) Credit Risk
4 3 (3.41%) Data Protection Act
4 3 (3.41%) Enterprise Software
4 3 (3.41%) iPad
4 3 (3.41%) iPhone
4 3 (3.41%) Mobile App
5 2 (2.27%) Management Information System
6 1 (1.14%) Cloud Native
Operating Systems
1 21 (23.86%) Windows
2 17 (19.32%) Linux
3 14 (15.91%) Unix
4 11 (12.50%) Windows Server
5 3 (3.41%) Android
5 3 (3.41%) Apple iOS
5 3 (3.41%) Mac OS
6 1 (1.14%) CentOS
6 1 (1.14%) Red Hat Enterprise Linux
6 1 (1.14%) VMS
Processes & Methodologies
1 30 (34.09%) Agile
2 29 (32.95%) DevOps
3 22 (25.00%) Software Engineering
4 18 (20.45%) Problem-Solving
5 17 (19.32%) Decision-Making
5 17 (19.32%) Infrastructure as Code
5 17 (19.32%) Process Improvement
6 16 (18.18%) Data Protection
7 15 (17.05%) Project Delivery
8 13 (14.77%) Test Automation
9 12 (13.64%) Microservices
10 11 (12.50%) Data Deduplication
10 11 (12.50%) Observability
10 11 (12.50%) SDLC
11 10 (11.36%) Cybersecurity
12 9 (10.23%) Data Transformation
13 8 (9.09%) Continuous Delivery
13 8 (9.09%) Continuous Integration
13 8 (9.09%) User Experience
13 8 (9.09%) UX Design
Programming Languages
1 36 (40.91%) Python
2 30 (34.09%) Java
3 15 (17.05%) SQL
4 11 (12.50%) JavaScript
4 11 (12.50%) TypeScript
5 4 (4.55%) Bash
5 4 (4.55%) Shell Script
6 3 (3.41%) Objective-C
6 3 (3.41%) PL/SQL
6 3 (3.41%) Swift
7 2 (2.27%) C#
8 1 (1.14%) Apex Code
8 1 (1.14%) C++
8 1 (1.14%) Go
8 1 (1.14%) PowerShell
8 1 (1.14%) SOQL
Qualifications
1 2 (2.27%) Azure Certification
1 2 (2.27%) Degree
2 1 (1.14%) PMI Certification
2 1 (1.14%) PMP
2 1 (1.14%) Security Cleared
2 1 (1.14%) TOGAF Certification
Quality Assurance & Compliance
1 7 (7.95%) Accessibility
2 4 (4.55%) Disclosure Scotland
3 3 (3.41%) WCAG
4 1 (1.14%) GDPR
4 1 (1.14%) NCSC
4 1 (1.14%) NIST
4 1 (1.14%) PCI DSS
4 1 (1.14%) QA
4 1 (1.14%) SLA
System Software
1 13 (14.77%) Docker
2 3 (3.41%) Veritas Cluster Server
3 2 (2.27%) Apache ZooKeeper
4 1 (1.14%) VMware Infrastructure
Systems Management
1 35 (39.77%) Kubernetes
2 32 (36.36%) Terraform
3 11 (12.50%) NetBackup
3 11 (12.50%) Oracle RMAN
4 8 (9.09%) Ansible
4 8 (9.09%) Grafana
5 5 (5.68%) Prometheus
6 2 (2.27%) Podman
6 2 (2.27%) Progress Chef
6 2 (2.27%) RSA Archer
7 1 (1.14%) Packer
7 1 (1.14%) Puppet
Vendors
1 14 (15.91%) Veritas
2 10 (11.36%) Oracle
3 9 (10.23%) Splunk
4 4 (4.55%) Databricks
5 3 (3.41%) Dynatrace
5 3 (3.41%) Netskope
5 3 (3.41%) Proofpoint
5 3 (3.41%) Symantec
5 3 (3.41%) VMware
6 2 (2.27%) Microsoft
7 1 (1.14%) Adobe
7 1 (1.14%) AppDynamics
7 1 (1.14%) Atlassian
7 1 (1.14%) MuleSoft
7 1 (1.14%) Okta
7 1 (1.14%) OpenAI
7 1 (1.14%) Salesforce
7 1 (1.14%) Talend