Public Sector Contract Job Trends in Glasgow

Public Sector
Scotland > Glasgow

The table below looks at the prevalence of the term Public Sector in contract job vacancies in Glasgow. Included is a benchmarking guide to the contractor rates offered in vacancies that cited Public Sector over the 6 months leading up to 27 November 2025, comparing them to the same period in the previous two years.

6 months to
27 Nov 2025
Same period 2024 Same period 2023
Rank 16 3 4
Rank change year-on-year -13 +1 -2
Contract jobs citing Public Sector 99 151 164
As % of all contract jobs in Glasgow 12.89% 20.46% 18.79%
As % of the General category 19.80% 31.26% 30.48%
Number of daily rates quoted 70 115 114
10th Percentile £237 £193 £154
25th Percentile £402 £376 £350
Median daily rate (50th Percentile) £478 £450 £500
Median % change year-on-year +6.17% -10.00% +1.52%
75th Percentile £575 £560 £588
90th Percentile £638 £681 £688
Scotland median daily rate £455 £450 £475
% change year-on-year +1.11% -5.26% -
Number of hourly rates quoted 2 7 1
10th Percentile £15.24 £18.52 -
25th Percentile £17.20 - -
Median hourly rate £21.01 £19.59 £12.26
Median % change year-on-year +7.25% +59.79% -17.39%
75th Percentile £25.35 £31.13 -
90th Percentile £27.63 £37.70 -
Scotland median hourly rate £17.15 £20.29 £18.21
% change year-on-year -15.45% +11.43% +6.84%

All General Skills
Glasgow

Public Sector falls under the General Skills category. For comparison with the information above, the following table provides summary statistics for all contract job vacancies requiring common skills in Glasgow.

Contract vacancies with a requirement for common skills 500 483 538
As % of all contract IT jobs advertised in Glasgow 65.10% 65.45% 61.63%
Number of daily rates quoted 343 315 377
10th Percentile £263 £216 £323
25th Percentile £375 £358 £412
Median daily rate (50th Percentile) £450 £450 £500
Median % change year-on-year - -10.00% +5.26%
75th Percentile £543 £538 £626
90th Percentile £625 £638 £725
Scotland median daily rate £455 £450 £480
% change year-on-year +1.11% -6.25% +1.05%
Number of hourly rates quoted 16 10 11
10th Percentile £19.19 £18.34 £12.00
25th Percentile £22.39 £19.59 £12.13
Median hourly rate £25.15 £21.87 £12.26
Median % change year-on-year +15.00% +78.38% -29.94%
75th Percentile £31.04 £32.81 £17.09
90th Percentile £47.09 £42.65 £19.50
Scotland median hourly rate £19.23 £19.59 £19.50
% change year-on-year -1.84% +0.46% +10.73%

Public Sector
Job Vacancy Trend in Glasgow

Historical trend showing the proportion of contract IT job postings citing Public Sector relative to all contract IT jobs advertised in Glasgow.
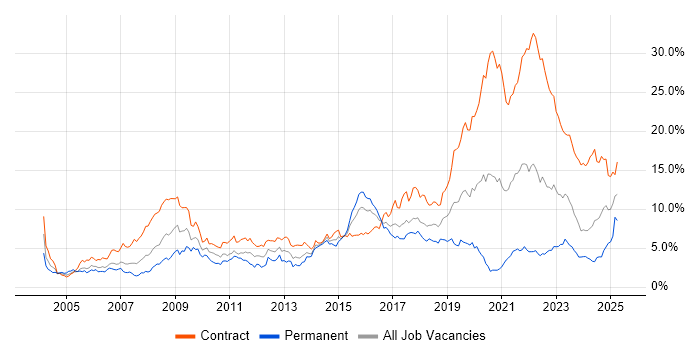
Public Sector job vacancy trend in Glasgow

Public Sector
Daily Rate Trend in Glasgow

Contractor daily rate distribution trend for jobs in Glasgow citing Public Sector.

Contractor daily rate distribution trend for jobs in Glasgow citing Public Sector

Public Sector
Daily Rate Histogram in Glasgow

Daily rate distribution for jobs citing Public Sector in Glasgow over the 6 months to 27 November 2025.

Daily rate histogram for Public Sector in Glasgow

Public Sector
Hourly Rate Trend in Glasgow

Contractor hourly rate distribution trend for jobs in Glasgow citing Public Sector.

Contractor hourly rate distribution trend for jobs in Glasgow citing Public Sector

Public Sector
Hourly Rate Histogram in Glasgow

Hourly rate distribution of jobs citing Public Sector in Glasgow over the 6 months to 27 November 2025.

Hourly rate histogram for Public Sector in Glasgow

Public Sector
Co-Occurring Skills & Capabilities in Glasgow by Category

The following tables expand on the one above by listing co-occurrences grouped by category. They cover the same employment type, locality and period, with up to 20 co-occurrences shown in each category:

Application Platforms
1 7 (7.07%) Microsoft Exchange
2 4 (4.04%) Confluence
3 2 (2.02%) Apache Airflow
3 2 (2.02%) Exchange Server 2013
3 2 (2.02%) SharePoint
3 2 (2.02%) WebLogic
4 1 (1.01%) Alfresco
4 1 (1.01%) Apache
4 1 (1.01%) Apache Solr
4 1 (1.01%) Apache Spark
4 1 (1.01%) ArcGIS
4 1 (1.01%) nginx
4 1 (1.01%) Oracle Coherence
Applications
1 8 (8.08%) Microsoft Excel
2 5 (5.05%) Microsoft Project
3 2 (2.02%) Microsoft PowerPoint
4 1 (1.01%) Adobe Creative Suite
4 1 (1.01%) Adobe Illustrator
4 1 (1.01%) InDesign
4 1 (1.01%) Microsoft Office
4 1 (1.01%) MS Visio
4 1 (1.01%) Photoshop
Business Applications
1 4 (4.04%) Dynamics CRM
2 1 (1.01%) iTrent
Cloud Services
1 25 (25.25%) AWS
2 19 (19.19%) Azure
3 10 (10.10%) Power Platform
4 9 (9.09%) Serverless
5 8 (8.08%) AWS CloudFormation
5 8 (8.08%) AWS Lambda
5 8 (8.08%) Microsoft 365
5 8 (8.08%) Virtual Private Cloud
6 7 (7.07%) Entra ID
7 6 (6.06%) Amazon CloudWatch
8 5 (5.05%) Amazon EKS
8 5 (5.05%) Amazon EventBridge
8 5 (5.05%) GitHub
8 5 (5.05%) SaaS
9 4 (4.04%) Amazon Kinesis
9 4 (4.04%) GitHub Actions
9 4 (4.04%) Slack
10 3 (3.03%) Amazon S3
10 3 (3.03%) Amazon SQS
10 3 (3.03%) Cloud Computing
Communications & Networking
1 7 (7.07%) WAN
2 4 (4.04%) VPN
3 3 (3.03%) Firewall
3 3 (3.03%) LAN
3 3 (3.03%) MPLS
4 2 (2.02%) SDH
5 1 (1.01%) BGP
5 1 (1.01%) Cisco ASA
5 1 (1.01%) Cisco ISE
5 1 (1.01%) Cisco Nexus
5 1 (1.01%) Ethernet VPN
5 1 (1.01%) F5 BIG-IP LTM
5 1 (1.01%) IPv4
5 1 (1.01%) Multicast
5 1 (1.01%) Network Security
5 1 (1.01%) OSPF
5 1 (1.01%) Software-Defined Networking
5 1 (1.01%) TETRA
5 1 (1.01%) VXLAN
5 1 (1.01%) Wireless
Database & Business Intelligence
1 9 (9.09%) Power BI
2 5 (5.05%) Amazon Athena
2 5 (5.05%) DynamoDB
2 5 (5.05%) MySQL
2 5 (5.05%) Relational Database
2 5 (5.05%) SQL Server
3 2 (2.02%) Amazon Aurora
3 2 (2.02%) Amazon RDS
3 2 (2.02%) Data Warehouse
3 2 (2.02%) Oracle Database
3 2 (2.02%) PostgreSQL
3 2 (2.02%) Power Query
3 2 (2.02%) Tableau
4 1 (1.01%) Amazon Redshift
4 1 (1.01%) Big Data
4 1 (1.01%) Delta Lake
4 1 (1.01%) Elasticsearch
4 1 (1.01%) Electronic Patient Records
4 1 (1.01%) MariaDB
4 1 (1.01%) Spatial Data
Development Applications
1 7 (7.07%) Git
2 5 (5.05%) Jenkins
2 5 (5.05%) JIRA
3 4 (4.04%) Terragrunt
4 3 (3.03%) webpack
5 2 (2.02%) CircleCI
5 2 (2.02%) Cucumber
5 2 (2.02%) GitLab
5 2 (2.02%) Oracle Forms
6 1 (1.01%) JUnit
6 1 (1.01%) MLflow
6 1 (1.01%) Mockito
6 1 (1.01%) NUnit
6 1 (1.01%) Selenium
6 1 (1.01%) Visual Studio
General
1 28 (28.28%) Social Skills
2 23 (23.23%) Analytical Skills
3 18 (18.18%) Finance
4 4 (4.04%) Influencing Skills
4 4 (4.04%) Organisational Skills
5 3 (3.03%) Telecoms
6 2 (2.02%) Local Government
7 1 (1.01%) Billing
7 1 (1.01%) Digital Healthcare
7 1 (1.01%) Documentation Skills
7 1 (1.01%) General Ledger
7 1 (1.01%) Inclusion and Diversity
7 1 (1.01%) Marketing
7 1 (1.01%) Presentation Skills
7 1 (1.01%) Publishing
Job Titles
1 20 (20.20%) Architect
2 17 (17.17%) Analyst
3 10 (10.10%) Developer
4 9 (9.09%) Solutions Architect
5 8 (8.08%) Senior
6 6 (6.06%) Business Analyst
7 5 (5.05%) Deployment Engineer
7 5 (5.05%) Lead
8 4 (4.04%) DevOps Engineer
8 4 (4.04%) Project Manager
8 4 (4.04%) Security Architect
8 4 (4.04%) Senior Data Warehouse Specialist
8 4 (4.04%) Technical Specialist
9 3 (3.03%) AWS Architect
9 3 (3.03%) Azure Engineer
9 3 (3.03%) Cloud Engineer
9 3 (3.03%) Cybersecurity Analyst
9 3 (3.03%) Front-End Developer (Client-Side Developer)
9 3 (3.03%) Security Analyst
10 2 (2.02%) IT Security Architect
Libraries, Frameworks & Software Standards
1 9 (9.09%) Node.js
2 6 (6.06%) React
3 5 (5.05%) HTML
3 5 (5.05%) RESTful
4 3 (3.03%) .NET
4 3 (3.03%) CSS
4 3 (3.03%) CSS3
4 3 (3.03%) HTML5
4 3 (3.03%) JSON
4 3 (3.03%) Redux
4 3 (3.03%) REST
5 2 (2.02%) AngularJS
5 2 (2.02%) J2EE
5 2 (2.02%) Spring
5 2 (2.02%) Spring Boot
6 1 (1.01%) ActiveMQ
6 1 (1.01%) ASP.NET
6 1 (1.01%) Hibernate
6 1 (1.01%) SOAP
6 1 (1.01%) XML
Miscellaneous
1 8 (8.08%) NHS
2 5 (5.05%) Device Driver
3 4 (4.04%) Analytical Mindset
3 4 (4.04%) Cyber Threat
3 4 (4.04%) IVR
3 4 (4.04%) Legacy Systems
3 4 (4.04%) Product Ownership
4 3 (3.03%) Cyber Defence
4 3 (3.03%) Management Information System
4 3 (3.03%) Security Operations Centre
5 2 (2.02%) Data Centre
5 2 (2.02%) Data Protection Act
5 2 (2.02%) Driving Licence
6 1 (1.01%) Algorithms
6 1 (1.01%) Cloud Native
6 1 (1.01%) Enterprise Software
6 1 (1.01%) Graphic Design
6 1 (1.01%) Hybrid Cloud
6 1 (1.01%) Low-Code
6 1 (1.01%) Public Cloud
Operating Systems
1 10 (10.10%) Linux
2 9 (9.09%) Windows
3 3 (3.03%) Windows Server
4 2 (2.02%) Unix
4 2 (2.02%) Windows 10
4 2 (2.02%) Windows Server 2012
Processes & Methodologies
1 18 (18.18%) CI/CD
2 17 (17.17%) Agile
2 17 (17.17%) Problem-Solving
3 15 (15.15%) Migration
4 14 (14.14%) Roadmaps
5 13 (13.13%) DevOps
5 13 (13.13%) Stakeholder Engagement
6 11 (11.11%) Infrastructure as Code
7 10 (10.10%) Analytics
7 10 (10.10%) Collaborative Working
7 10 (10.10%) Microservices
8 9 (9.09%) Business Intelligence
8 9 (9.09%) Mentoring
8 9 (9.09%) Stakeholder Management
9 8 (8.08%) Continuous Improvement
9 8 (8.08%) Decision-Making
9 8 (8.08%) SDLC
10 7 (7.07%) Coaching
10 7 (7.07%) Cybersecurity
10 7 (7.07%) Digital Transformation Programme
Programming Languages
1 18 (18.18%) Python
2 13 (13.13%) Java
3 8 (8.08%) TypeScript
4 7 (7.07%) JavaScript
5 4 (4.04%) PowerShell
6 3 (3.03%) Bicep
6 3 (3.03%) SQL
7 2 (2.02%) C#
7 2 (2.02%) Data Analysis Expressions
7 2 (2.02%) R
8 1 (1.01%) Bash
8 1 (1.01%) Go
8 1 (1.01%) Shell Script
Qualifications
1 28 (28.28%) Security Cleared
2 15 (15.15%) SC Cleared
3 14 (14.14%) Degree
4 8 (8.08%) BPSS Clearance
4 8 (8.08%) CISSP
5 7 (7.07%) Microsoft Certification
6 5 (5.05%) MCSA
7 4 (4.04%) Azure Certification
7 4 (4.04%) CISM
8 3 (3.03%) CEH
8 3 (3.03%) CompTIA Security+
8 3 (3.03%) Computer Science Degree
8 3 (3.03%) DV Cleared
8 3 (3.03%) GIAC
8 3 (3.03%) SSCP
9 2 (2.02%) AWS Certification
9 2 (2.02%) AWS Certified Solutions Architect
9 2 (2.02%) CompTIA CySA+
9 2 (2.02%) Master's Degree
10 1 (1.01%) CESG Certified Professional
Quality Assurance & Compliance
1 12 (12.12%) GDPR
2 8 (8.08%) QA
3 5 (5.05%) ISO/IEC 27001
3 5 (5.05%) PMO
4 4 (4.04%) Disclosure Scotland
4 4 (4.04%) PCI DSS
5 3 (3.03%) Accessibility
5 3 (3.03%) HIPAA
5 3 (3.03%) SLA
6 2 (2.02%) Data Quality
7 1 (1.01%) Cyber Essentials
7 1 (1.01%) NCSC
7 1 (1.01%) WCAG
System Software
1 6 (6.06%) Active Directory
2 4 (4.04%) Docker
3 3 (3.03%) Virtual Machines
Systems Management
1 13 (13.13%) Terraform
2 8 (8.08%) Kubernetes
3 5 (5.05%) SCCM
4 4 (4.04%) Argo
4 4 (4.04%) Istio
5 3 (3.03%) Prometheus
6 2 (2.02%) Grafana
6 2 (2.02%) Single Sign-On
7 1 (1.01%) Kibana
7 1 (1.01%) logstash
Vendors
1 31 (31.31%) Microsoft
2 7 (7.07%) Cisco
2 7 (7.07%) Oracle
3 4 (4.04%) Pega
3 4 (4.04%) Salesforce
3 4 (4.04%) ServiceNow
3 4 (4.04%) Splunk
4 3 (3.03%) Avaya
4 3 (3.03%) Genesys
5 2 (2.02%) F5
5 2 (2.02%) Red Hat
5 2 (2.02%) SAP
6 1 (1.01%) Adobe
6 1 (1.01%) ArcSight
6 1 (1.01%) CheckPoint
6 1 (1.01%) Databricks
6 1 (1.01%) ForgeRock
6 1 (1.01%) Meraki
6 1 (1.01%) Remedy
6 1 (1.01%) SolarWinds