Azure Contract Job Trends in Leeds

Microsoft Azure
West Yorkshire > Leeds

The table below provides summary statistics and contractor rates for jobs advertised in Leeds requiring Azure skills. It covers contract job vacancies from the 6 months leading up to 28 October 2025, with comparisons to the same periods in the previous two years.

6 months to
28 Oct 2025
Same period 2024 Same period 2023
Rank 4 5 6
Rank change year-on-year +1 +1 -2
Contract jobs citing Azure 128 110 147
As % of all contract jobs in Leeds 18.58% 16.54% 14.09%
As % of the Cloud Services category 39.75% 36.54% 42.12%
Number of daily rates quoted 78 77 107
10th Percentile £290 £400 £375
25th Percentile £389 £406 £425
Median daily rate (50th Percentile) £495 £500 £550
Median % change year-on-year -1.00% -9.09% -
75th Percentile £547 £575 £600
90th Percentile £679 £655 £700
West Yorkshire median daily rate £500 £500 £550
% change year-on-year - -9.09% -
Number of hourly rates quoted 0 0 1
Median hourly rate - - £62.00
West Yorkshire median hourly rate - - £62.00

All Cloud Skills
Leeds

Azure falls under the Cloud Services category. For comparison with the information above, the following table provides summary statistics for all contract job vacancies requiring cloud computing skills in Leeds.

Contract vacancies with a requirement for cloud computing skills 322 301 349
As % of all contract IT jobs advertised in Leeds 46.73% 45.26% 33.46%
Number of daily rates quoted 206 216 264
10th Percentile £344 £340 £304
25th Percentile £400 £400 £425
Median daily rate (50th Percentile) £500 £475 £500
Median % change year-on-year +5.26% -5.05% -4.71%
75th Percentile £550 £552 £600
90th Percentile £625 £650 £682
West Yorkshire median daily rate £500 £475 £500
% change year-on-year +5.26% -5.00% -4.76%
Number of hourly rates quoted 1 1 1
10th Percentile - - -
25th Percentile £26.25 £26.25 -
Median hourly rate £27.50 £27.50 £62.00
Median % change year-on-year - -55.65% +188.37%
75th Percentile £28.75 £28.75 -
90th Percentile - - -
West Yorkshire median hourly rate £113.75 £27.50 £62.00
% change year-on-year +313.64% -55.65% +175.56%

Azure
Job Vacancy Trend in Leeds

Historical trend showing the proportion of contract IT job postings citing Azure relative to all contract IT jobs advertised in Leeds.
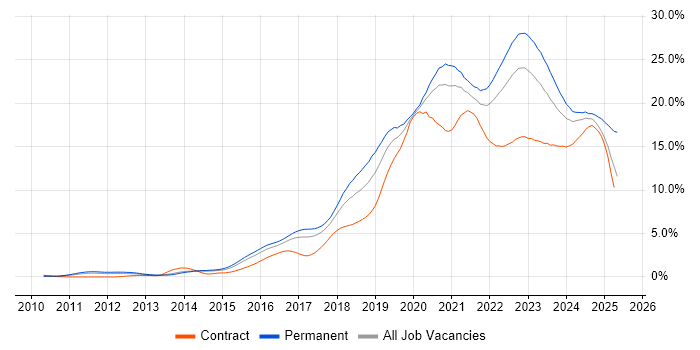
Azure job vacancy trend in Leeds

Azure
Daily Rate Trend in Leeds

Contractor daily rate distribution trend for jobs in Leeds citing Azure.

Contractor daily rate distribution trend for jobs in Leeds citing Azure

Azure
Daily Rate Histogram in Leeds

Daily rate distribution for jobs citing Azure in Leeds over the 6 months to 28 October 2025.

Daily rate histogram for Azure in Leeds

Azure
Hourly Rate Trend in Leeds

Contractor hourly rate distribution trend for jobs in Leeds citing Azure.

Contractor hourly rate distribution trend for jobs in Leeds citing Azure

Azure
Co-Occurring Skills & Capabilities in Leeds by Category

The following tables expand on the one above by listing co-occurrences grouped by category. They cover the same employment type, locality and period, with up to 20 co-occurrences shown in each category:

Application Platforms
1 10 (7.81%) Confluence
2 8 (6.25%) Microsoft Exchange
3 5 (3.91%) SharePoint
4 4 (3.13%) Apache
4 4 (3.13%) Apache Spark
5 3 (2.34%) Apache Airflow
5 3 (2.34%) CMS
Applications
1 5 (3.91%) Microsoft Office
2 1 (0.78%) Microsoft Project
Business Applications
1 3 (2.34%) Dynamics CRM
1 3 (2.34%) Payment Gateway
2 1 (0.78%) Magento
2 1 (0.78%) Shopify
Cloud Services
1 60 (46.88%) AWS
2 46 (35.94%) GCP
3 22 (17.19%) Azure DevOps
4 14 (10.94%) GitHub
4 14 (10.94%) Serverless
5 12 (9.38%) Microsoft 365
5 12 (9.38%) Power Platform
6 10 (7.81%) PaaS
7 8 (6.25%) Azure Functions
7 8 (6.25%) GitHub Actions
8 7 (5.47%) Entra ID
9 5 (3.91%) Azure Storage
9 5 (3.91%) Azure Synapse Analytics
9 5 (3.91%) Dynamics 365
9 5 (3.91%) PowerApps
10 4 (3.13%) Azure Logic Apps
10 4 (3.13%) Azure Sentinel
10 4 (3.13%) Power Automate
11 3 (2.34%) dbt
11 3 (2.34%) Figma
Communications & Networking
1 16 (12.50%) Firewall
2 5 (3.91%) Network Security
2 5 (3.91%) Wi-Fi
3 3 (2.34%) LAN
3 3 (2.34%) WAN
4 2 (1.56%) DHCP
4 2 (1.56%) DNS
4 2 (1.56%) Reverse Proxy
4 2 (1.56%) TCP/IP
4 2 (1.56%) VLAN
4 2 (1.56%) VoIP
4 2 (1.56%) VPN
5 1 (0.78%) BGP
5 1 (0.78%) Cisco ASA
5 1 (0.78%) EIGRP
5 1 (0.78%) HTTP
5 1 (0.78%) OSPF
5 1 (0.78%) SD-WAN
5 1 (0.78%) Wireless
Database & Business Intelligence
1 11 (8.59%) NoSQL
1 11 (8.59%) SQL Server
2 8 (6.25%) Power BI
3 7 (5.47%) Relational Database
4 6 (4.69%) Data Warehouse
5 5 (3.91%) PostgreSQL
6 4 (3.13%) BigQuery
6 4 (3.13%) MongoDB
6 4 (3.13%) MySQL
6 4 (3.13%) RDBMS
6 4 (3.13%) Redis
6 4 (3.13%) Tableau
7 3 (2.34%) Amazon Redshift
7 3 (2.34%) Data Lake
8 2 (1.56%) Amazon Athena
8 2 (1.56%) Azure SQL Database
8 2 (1.56%) Bigtable
8 2 (1.56%) Enterprise Data Warehouse
8 2 (1.56%) Power Query
8 2 (1.56%) SQL Server Reporting Services
Development Applications
1 18 (14.06%) Jenkins
2 16 (12.50%) Git
3 15 (11.72%) JIRA
4 7 (5.47%) GitLab
5 6 (4.69%) SonarQube
6 5 (3.91%) CircleCI
7 4 (3.13%) Artifactory
7 4 (3.13%) Maven
7 4 (3.13%) Mocha
7 4 (3.13%) Sonatype Nexus
8 3 (2.34%) Selenium
8 3 (2.34%) Storybook
9 2 (1.56%) Gradle
9 2 (1.56%) JMeter
9 2 (1.56%) JUnit
9 2 (1.56%) Log4j
9 2 (1.56%) Mockito
9 2 (1.56%) Subversion
9 2 (1.56%) webpack
10 1 (0.78%) SpecFlow
General
1 39 (30.47%) Social Skills
2 24 (18.75%) Public Sector
3 14 (10.94%) Finance
4 12 (9.38%) Banking
5 8 (6.25%) Legal
6 7 (5.47%) Retail
7 6 (4.69%) Analytical Skills
7 6 (4.69%) Documentation Skills
8 2 (1.56%) Local Government
8 2 (1.56%) Presentation Skills
9 1 (0.78%) Digital Health
9 1 (0.78%) Inclusion and Diversity
9 1 (0.78%) Retail Banking
9 1 (0.78%) Tech for Good
Job Titles
1 21 (16.41%) Architect
2 20 (15.63%) Developer
3 19 (14.84%) Senior
4 12 (9.38%) Lead
5 11 (8.59%) Software Engineer
6 10 (7.81%) Analyst
6 10 (7.81%) DevOps Engineer
6 10 (7.81%) Solutions Architect
7 8 (6.25%) .NET Software Engineer
7 8 (6.25%) AWS Engineer
8 7 (5.47%) AWS DevOps
8 7 (5.47%) AWS DevOps Engineer
8 7 (5.47%) NetBackup Engineer
9 6 (4.69%) Data Engineer
9 6 (4.69%) Security Architect
9 6 (4.69%) Tester
10 5 (3.91%) Infrastructure Engineer
10 5 (3.91%) Senior Developer
10 5 (3.91%) Support Analyst
11 4 (3.13%) Java Developer
Libraries, Frameworks & Software Standards
1 19 (14.84%) .NET
2 15 (11.72%) React
3 14 (10.94%) Node.js
3 14 (10.94%) RESTful
4 10 (7.81%) CSS
4 10 (7.81%) HTML
5 6 (4.69%) AngularJS
5 6 (4.69%) Express.js
5 6 (4.69%) Jest
5 6 (4.69%) JWT
5 6 (4.69%) OAuth
5 6 (4.69%) SAML
6 5 (3.91%) CSS3
6 5 (3.91%) HTML5
7 4 (3.13%) FHIR
7 4 (3.13%) Kafka
7 4 (3.13%) Next.js
7 4 (3.13%) REST
7 4 (3.13%) Spring
7 4 (3.13%) Spring Boot
Miscellaneous
1 17 (13.28%) Cloud Native
2 11 (8.59%) NHS
3 8 (6.25%) Product Ownership
4 6 (4.69%) Hybrid Cloud
5 5 (3.91%) Legacy Systems
5 5 (3.91%) Public Cloud
6 3 (2.34%) Data Structures
6 3 (2.34%) Enterprise Software
6 3 (2.34%) Security Posture
7 2 (1.56%) Algorithms
7 2 (1.56%) Blockchain
7 2 (1.56%) CMDB
7 2 (1.56%) Data Protection Act
7 2 (1.56%) iPhone
7 2 (1.56%) Management Information System
7 2 (1.56%) Onboarding
8 1 (0.78%) Client/Server
8 1 (0.78%) Cloud Security Posture
8 1 (0.78%) Distributed Computing
8 1 (0.78%) Private Cloud
Operating Systems
1 15 (11.72%) Linux
2 14 (10.94%) Windows
3 4 (3.13%) Windows Server
4 3 (2.34%) Unix
5 2 (1.56%) Android
5 2 (1.56%) Windows 10
6 1 (0.78%) Mac OS X
Processes & Methodologies
1 38 (29.69%) DevOps
2 34 (26.56%) CI/CD
3 25 (19.53%) Agile
4 22 (17.19%) Microservices
5 20 (15.63%) Containerisation
6 19 (14.84%) Infrastructure as Code
7 16 (12.50%) Stakeholder Management
8 15 (11.72%) Translating Business Requirements
9 14 (10.94%) Software Engineering
10 13 (10.16%) Cloud Security
10 13 (10.16%) Continuous Improvement
10 13 (10.16%) ITIL
11 12 (9.38%) Cybersecurity
11 12 (9.38%) Disaster Recovery
11 12 (9.38%) Roadmaps
11 12 (9.38%) Test Automation
12 11 (8.59%) Analytics
13 10 (7.81%) Clean Code
13 10 (7.81%) Data Protection
13 10 (7.81%) Migration
Programming Languages
1 32 (25.00%) Python
2 30 (23.44%) SQL
3 22 (17.19%) JavaScript
4 16 (12.50%) C#
5 15 (11.72%) PowerShell
6 14 (10.94%) Bash
6 14 (10.94%) Java
7 9 (7.03%) TypeScript
8 4 (3.13%) Bicep
9 3 (2.34%) Data Analysis Expressions
9 3 (2.34%) Rust
10 2 (1.56%) ANSI SQL
10 2 (1.56%) Scala
10 2 (1.56%) Shell Script
10 2 (1.56%) Solidity
11 1 (0.78%) Go
11 1 (0.78%) VB
11 1 (0.78%) VB6
Qualifications
1 17 (13.28%) Security Cleared
2 13 (10.16%) SC Cleared
3 4 (3.13%) AWS Certification
3 4 (3.13%) Cisco Certification
3 4 (3.13%) CISSP
4 2 (1.56%) (ISC)2 CCSP
4 2 (1.56%) Azure Certification
4 2 (1.56%) BPSS Clearance
4 2 (1.56%) CCNA
4 2 (1.56%) CCSK
4 2 (1.56%) CCSP
4 2 (1.56%) CEH
4 2 (1.56%) CISA
4 2 (1.56%) CISM
4 2 (1.56%) Microsoft Certification
4 2 (1.56%) OSCP
5 1 (0.78%) BC Cleared
5 1 (0.78%) Degree
5 1 (0.78%) DV Cleared
5 1 (0.78%) TOGAF Certification
Quality Assurance & Compliance
1 7 (5.47%) Accessibility
1 7 (5.47%) GDPR
2 6 (4.69%) ISO/IEC 27001
3 5 (3.91%) NIST
3 5 (3.91%) QA
4 4 (3.13%) PCI DSS
4 4 (3.13%) WCAG
5 3 (2.34%) Data Quality
5 3 (2.34%) NCSC
6 2 (1.56%) COBIT
6 2 (1.56%) GRC
6 2 (1.56%) PSD2
6 2 (1.56%) SOC 2
7 1 (0.78%) HL7
7 1 (0.78%) Sarbanes-Oxley
System Software
1 24 (18.75%) Docker
2 11 (8.59%) Active Directory
3 9 (7.03%) VMware Infrastructure
4 2 (1.56%) Hyper-V
5 1 (0.78%) vSphere
Systems Management
1 31 (24.22%) Terraform
2 17 (13.28%) Kubernetes
3 8 (6.25%) Prometheus
4 7 (5.47%) NetBackup
4 7 (5.47%) Oracle RMAN
5 6 (4.69%) Ansible
5 6 (4.69%) Grafana
6 3 (2.34%) Microsoft Intune
7 2 (1.56%) Control-M
7 2 (1.56%) SCCM
8 1 (0.78%) Oracle Identity Manager
8 1 (0.78%) Progress Chef
8 1 (0.78%) Puppet
8 1 (0.78%) SCOM
Vendors
1 31 (24.22%) Microsoft
2 18 (14.06%) Google
3 11 (8.59%) Oracle
4 10 (7.81%) Databricks
4 10 (7.81%) VMware
5 8 (6.25%) CyberArk
5 8 (6.25%) HP
6 7 (5.47%) Veritas
7 6 (4.69%) Salesforce
7 6 (4.69%) ServiceNow
8 5 (3.91%) Apple
8 5 (3.91%) MobileIron
8 5 (3.91%) Splunk
9 4 (3.13%) Cisco
10 3 (2.34%) Brio
10 3 (2.34%) Dynatrace
11 2 (1.56%) CheckPoint
11 2 (1.56%) F5
11 2 (1.56%) McAfee
11 2 (1.56%) MuleSoft