Oracle
North West > Manchester
The table below provides summary statistics for contract job vacancies advertised in Manchester requiring knowledge or experience of Oracle products and/or services. It includes a benchmarking guide to contractor rates offered in vacancies that cited Oracle over the 6 months leading up to 1 May 2025, comparing them to the same period in the previous two years.
The figures below represent the IT contractor job market in general and are not representative of contractor rates within the Oracle Corporation.
| 6 months to 1 May 2025 |
Same period 2024 | Same period 2023 | |
|---|---|---|---|
| Rank | 37 | 61 | 62 |
| Rank change year-on-year | +24 | +1 | -8 |
| Contract jobs citing Oracle | 43 | 35 | 56 |
| As % of all contract jobs advertised in Manchester | 4.64% | 2.31% | 2.96% |
| As % of the Vendors category | 9.73% | 6.60% | 8.38% |
| Number of daily rates quoted | 37 | 29 | 43 |
| 10th Percentile | £404 | £423 | £402 |
| 25th Percentile | £445 | £425 | £425 |
| Median daily rate (50th Percentile) | £475 | £500 | £525 |
| Median % change year-on-year | -5.00% | -4.76% | - |
| 75th Percentile | £630 | £534 | £647 |
| 90th Percentile | £673 | £623 | £700 |
| North West median daily rate | £475 | £500 | £590 |
| % change year-on-year | -5.00% | -15.25% | +12.38% |
| Number of hourly rates quoted | 0 | 4 | 0 |
| Median hourly rate | - | £26.00 | - |
| North West median hourly rate | £30.40 | £36.94 | £40.59 |
| % change year-on-year | -17.70% | -8.99% | +2.17% |
All Vendors
Manchester
Oracle falls under the Vendor Products and Services category. For comparison with the information above, the following table provides summary statistics for all contract job vacancies requiring knowledge or experience of all vendor products and services in Manchester.
| Contract vacancies with a requirement for knowledge or experience of vendor products and services | 442 | 530 | 668 |
| As % of all contract IT jobs advertised in Manchester | 47.73% | 34.94% | 35.29% |
| Number of daily rates quoted | 311 | 353 | 476 |
| 10th Percentile | £230 | £313 | £300 |
| 25th Percentile | £398 | £400 | £397 |
| Median daily rate (50th Percentile) | £475 | £500 | £500 |
| Median % change year-on-year | -5.00% | - | +1.01% |
| 75th Percentile | £575 | £600 | £588 |
| 90th Percentile | £675 | £703 | £656 |
| North West median daily rate | £495 | £500 | £500 |
| % change year-on-year | -1.00% | - | +7.53% |
| Number of hourly rates quoted | 13 | 42 | 16 |
| 10th Percentile | £13.00 | £11.81 | £13.31 |
| 25th Percentile | £14.20 | £12.51 | £18.73 |
| Median hourly rate | £32.50 | £17.72 | £32.60 |
| Median % change year-on-year | +83.41% | -45.64% | +93.30% |
| 75th Percentile | £60.00 | £26.50 | £65.00 |
| 90th Percentile | - | £60.00 | - |
| North West median hourly rate | £32.50 | £16.06 | £37.50 |
| % change year-on-year | +102.37% | -57.17% | +97.73% |
Oracle
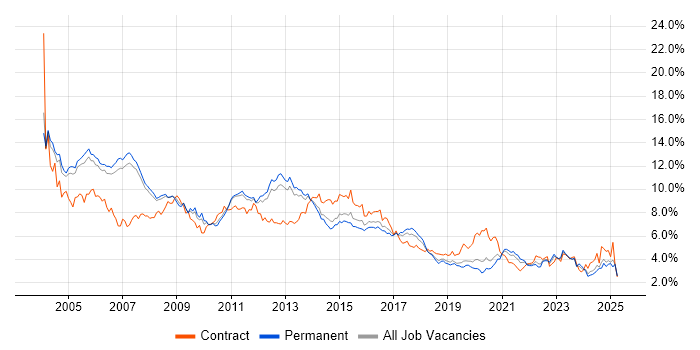
Job Vacancy Trend in Manchester
Job postings citing Oracle as a proportion of all IT jobs advertised in Manchester.

Oracle
Contractor Daily Rate Trend in Manchester
3-month moving average daily rate quoted in jobs citing Oracle in Manchester.
Oracle
Daily Rate Histogram in Manchester
Daily rate distribution for jobs citing Oracle in Manchester over the 6 months to 1 May 2025.
Oracle
Contractor Hourly Rate Trend in Manchester
3-month moving average hourly rates quoted in jobs citing Oracle in Manchester.
Oracle
Co-occurring Skills and Capabilities in Manchester by Category
The follow tables expand on the table above by listing co-occurrences grouped by category. The same employment type, locality and period is covered with up to 20 co-occurrences shown in each of the following categories:
|
|
|||||||||||||||||||||||||||||||||||||||||||||||||||||||||||||||||||||||||||||||||||||||||||||||||||||||||||||||
|
|
|||||||||||||||||||||||||||||||||||||||||||||||||||||||||||||||||||||||||||||||||||||||||||||||||||||||||||||||
|
|
|||||||||||||||||||||||||||||||||||||||||||||||||||||||||||||||||||||||||||||||||||||||||||||||||||||||||||||||
|
|
|||||||||||||||||||||||||||||||||||||||||||||||||||||||||||||||||||||||||||||||||||||||||||||||||||||||||||||||
|
|
|||||||||||||||||||||||||||||||||||||||||||||||||||||||||||||||||||||||||||||||||||||||||||||||||||||||||||||||
|
|
|||||||||||||||||||||||||||||||||||||||||||||||||||||||||||||||||||||||||||||||||||||||||||||||||||||||||||||||
|
|
|||||||||||||||||||||||||||||||||||||||||||||||||||||||||||||||||||||||||||||||||||||||||||||||||||||||||||||||
|
|
|||||||||||||||||||||||||||||||||||||||||||||||||||||||||||||||||||||||||||||||||||||||||||||||||||||||||||||||
|
||||||||||||||||||||||||||||||||||||||||||||||||||||||||||||||||||||||||||||||||||||||||||||||||||||||||||||||||
