Public Cloud Contracts in the North of England

Public Cloud
England > North of England

The table below looks at the prevalence of the term Public Cloud in contract job vacancies advertised in the North of England. Included is a benchmarking guide to the contractor rates offered in vacancies that have cited Public Cloud over the 6 months to 27 April 2024 with a comparison to the same period over the previous 2 years.

6 months to
27 Apr 2024
Same period 2023 Same period 2022
Rank 122 116 138
Rank change year-on-year -6 +22 +2
Contract jobs citing Public Cloud 63 108 114
As % of all contract jobs advertised in the North of England 1.32% 1.85% 1.58%
As % of the Miscellaneous category 4.86% 6.00% 4.66%
Number of daily rates quoted 39 78 77
10th Percentile £504 £431 £363
25th Percentile £557 £500 £513
Median daily rate (50th Percentile) £750 £566 £560
Median % change year-on-year +32.45% +1.12% +12.00%
75th Percentile £850 £700 £650
90th Percentile - £775 £725
England median daily rate £610 £625 £613
% change year-on-year -2.40% +2.04% +16.67%

All Generic Skills
North of England

Public Cloud is in the General and Transferable Skills category. The following table is for comparison with the above and provides summary statistics for all contract job vacancies advertised in the North of England with a requirement for generic IT skills.

Contract vacancies with a requirement for generic IT skills 1,295 1,801 2,445
As % of all contract IT jobs advertised in the North of England 27.18% 30.85% 33.87%
Number of daily rates quoted 796 1,220 1,824
10th Percentile £251 £281 £200
25th Percentile £400 £410 £350
Median daily rate (50th Percentile) £498 £524 £475
Median % change year-on-year -5.01% +10.26% +11.76%
75th Percentile £583 £619 £575
90th Percentile £653 £688 £657
England median daily rate £550 £575 £550
% change year-on-year -4.35% +4.55% +10.00%
Number of hourly rates quoted 152 91 108
10th Percentile £12.15 £9.80 £11.36
25th Percentile £13.00 £10.63 £12.79
Median hourly rate £15.05 £20.00 £18.60
Median % change year-on-year -24.74% +7.53% +3.91%
75th Percentile £26.50 £42.95 £26.63
90th Percentile £48.49 £66.00 £43.83
England median hourly rate £30.00 £22.50 £26.98
% change year-on-year +33.33% -16.60% +1.24%

Public Cloud
Job Vacancy Trend in the North of England

Job postings citing Public Cloud as a proportion of all IT jobs advertised in the North of England.
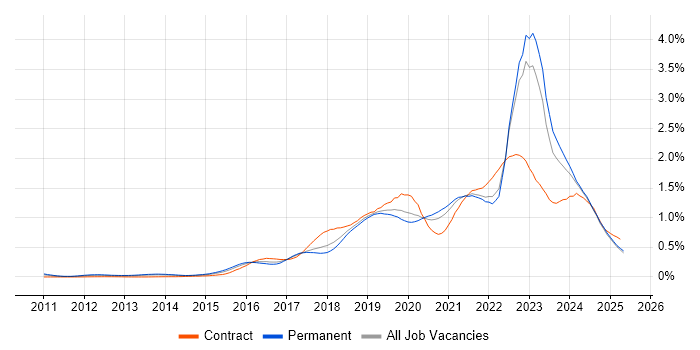
Job vacancy trend for Public Cloud in the North of England

Public Cloud
Contractor Daily Rate Trend in the North of England

3-month moving average daily rate quoted in jobs citing Public Cloud in the North of England.

Daily rate trend for Public Cloud in the North of England

Public Cloud
Daily Rate Histogram in the North of England

Daily rate distribution for jobs citing Public Cloud in the North of England over the 6 months to 27 April 2024.

Daily rate histogram for Public Cloud in the North of England

Public Cloud
Contract Job Locations in the North of England

The table below looks at the demand and provides a guide to the median contractor rates quoted in IT jobs citing Public Cloud within the North of England region over the 6 months to 27 April 2024. The 'Rank Change' column provides an indication of the change in demand within each location based on the same 6 month period last year.

Location Rank Change
on Same Period
Last Year
Matching
Contract
IT Job Ads
Median
Daily Rate
Past 6 Months
Median Daily Rate
% Change
on Same Period
Last Year
Live
Jobs
North West +29 51 £850 +41.67% 18
Yorkshire -18 11 £538 -2.27% 16
North East -4 1 £525 -32.26% 4
Public Cloud
England

Public Cloud
Co-occurring Skills and Capabilities in the North of England by Category

The follow tables expand on the table above by listing co-occurrences grouped by category. The same employment type, locality and period is covered with up to 20 co-occurrences shown in each of the following categories:

Application Platforms
1 1 (1.59%) Confluence
1 1 (1.59%) Microsoft Exchange
Cloud Services
1 21 (33.33%) AWS
2 19 (30.16%) Azure
3 6 (9.52%) GCP
4 5 (7.94%) Amazon CloudWatch
5 4 (6.35%) GitHub
5 4 (6.35%) GitHub Actions
6 2 (3.17%) Amazon EMR
6 2 (3.17%) Amazon SageMaker
6 2 (3.17%) AWS CloudFormation
6 2 (3.17%) AWS Lambda
6 2 (3.17%) Entra ID
6 2 (3.17%) OpenShift
6 2 (3.17%) Serverless
6 2 (3.17%) Virtual Private Cloud
7 1 (1.59%) Amazon ECS
7 1 (1.59%) Amazon EKS
7 1 (1.59%) AWS KMS
7 1 (1.59%) Azure Key Vault
7 1 (1.59%) Azure Sentinel
7 1 (1.59%) Kong
Communications & Networking
1 31 (49.21%) Firewall
2 30 (47.62%) VPN
3 7 (11.11%) DSL
4 2 (3.17%) SSL
5 1 (1.59%) DNS
5 1 (1.59%) SAN
Database & Business Intelligence
1 7 (11.11%) SQL Server
2 5 (7.94%) Relational Database
3 4 (6.35%) MySQL
4 1 (1.59%) BigQuery
4 1 (1.59%) Data Hub
4 1 (1.59%) DB2
4 1 (1.59%) Enterprise Data Warehouse
4 1 (1.59%) MongoDB
4 1 (1.59%) Oracle Database
4 1 (1.59%) Oracle Exadata
Development Applications
1 13 (20.63%) Jenkins
2 8 (12.70%) JIRA
3 5 (7.94%) GitLab
4 4 (6.35%) AppScan
4 4 (6.35%) Burp Suite
4 4 (6.35%) Git
4 4 (6.35%) SonarQube
5 1 (1.59%) Bitbucket
5 1 (1.59%) Cucumber
5 1 (1.59%) Maven
5 1 (1.59%) Postman
5 1 (1.59%) Sonatype Nexus
General
1 19 (30.16%) Finance
2 11 (17.46%) Public Sector
3 10 (15.87%) Banking
3 10 (15.87%) Social Skills
4 7 (11.11%) Analytical Skills
5 6 (9.52%) Billing
5 6 (9.52%) Legal
6 1 (1.59%) Inclusion and Diversity
6 1 (1.59%) Military
Job Titles
1 34 (53.97%) Architect
2 32 (50.79%) Technical Architect
3 27 (42.86%) Lead
3 27 (42.86%) Lead Architect
3 27 (42.86%) Technical Leader
4 7 (11.11%) Windows Engineer
5 6 (9.52%) Commercial Manager
5 6 (9.52%) Contracts Manager
6 4 (6.35%) Cloud Architect
6 4 (6.35%) Digital Architect
6 4 (6.35%) Digital Technical Architect
6 4 (6.35%) Site Engineer
6 4 (6.35%) Site Reliability Engineer
7 3 (4.76%) Developer
7 3 (4.76%) Python Developer
8 2 (3.17%) AWS Developer
8 2 (3.17%) Cloud Developer
8 2 (3.17%) DevOps Engineer
8 2 (3.17%) Lead Cloud Architect
8 2 (3.17%) Senior
Libraries, Frameworks & Software Standards
1 27 (42.86%) Node.js
2 4 (6.35%) Elastic Stack
3 2 (3.17%) Lambda Expressions
4 1 (1.59%) JSON
4 1 (1.59%) Kafka
4 1 (1.59%) OAuth
4 1 (1.59%) Oracle GoldenGate
4 1 (1.59%) YAML
Miscellaneous
1 9 (14.29%) Product Ownership
2 7 (11.11%) Virtual Team
3 5 (7.94%) Mobile App
4 1 (1.59%) Cloud Native
4 1 (1.59%) Credit Risk
4 1 (1.59%) Cyber Kill Chain
4 1 (1.59%) Data Centre
4 1 (1.59%) Data Fabric
4 1 (1.59%) Enterprise Software
4 1 (1.59%) Legacy Applications
4 1 (1.59%) PKI
4 1 (1.59%) Private Cloud
4 1 (1.59%) Replication
4 1 (1.59%) Self-Motivation
Operating Systems
1 42 (66.67%) Windows
2 31 (49.21%) Android
2 31 (49.21%) Apple iOS
2 31 (49.21%) Windows Server
3 17 (26.98%) Linux
4 8 (12.70%) Unix
5 2 (3.17%) Red Hat Enterprise Linux
5 2 (3.17%) zOS
Processes & Methodologies
1 49 (77.78%) DevOps
2 44 (69.84%) Agile
3 43 (68.25%) CI/CD
4 31 (49.21%) Design Patterns
4 31 (49.21%) Mobile Device Management
5 30 (47.62%) Risk Management
6 29 (46.03%) Security Architecture
7 28 (44.44%) Zero Trust
8 27 (42.86%) Cyber Threat Intelligence
8 27 (42.86%) Threat Intelligence
9 17 (26.98%) Microservices
9 17 (26.98%) Roadmaps
10 12 (19.05%) Product Strategy
10 12 (19.05%) Strategic Roadmap
11 10 (15.87%) Change Control
11 10 (15.87%) Containerisation
11 10 (15.87%) Infrastructure as Code
11 10 (15.87%) Technical Leadership
12 9 (14.29%) Product Roadmap
13 8 (12.70%) Project Delivery
Programming Languages
1 9 (14.29%) Python
2 8 (12.70%) Ruby
3 4 (6.35%) Bash
3 4 (6.35%) PowerShell
4 1 (1.59%) Go
4 1 (1.59%) Perl
4 1 (1.59%) Shell Script
4 1 (1.59%) SQL
Qualifications
1 16 (25.40%) Security Cleared
2 15 (23.81%) SC Cleared
3 1 (1.59%) BPSS Clearance
3 1 (1.59%) Degree
3 1 (1.59%) MCSE
3 1 (1.59%) Microsoft Certification
3 1 (1.59%) RHCE
Quality Assurance & Compliance
1 6 (9.52%) SLA
2 4 (6.35%) QA
3 1 (1.59%) ISO/IEC 27001
3 1 (1.59%) ISO/IEC 27002 (supersedes ISO/IEC 17799)
3 1 (1.59%) NIST
System Software
1 7 (11.11%) Docker
2 1 (1.59%) Active Directory
2 1 (1.59%) Hyper-V
2 1 (1.59%) Oracle RAC
2 1 (1.59%) VMware Infrastructure
Systems Management
1 14 (22.22%) Ansible
2 13 (20.63%) Progress Chef
3 12 (19.05%) Puppet
4 8 (12.70%) Kubernetes
5 7 (11.11%) CFEngine
5 7 (11.11%) PowerBroker
5 7 (11.11%) Terraform
6 5 (7.94%) Prometheus
7 4 (6.35%) Grafana
7 4 (6.35%) Graylog
7 4 (6.35%) HP Fortify
7 4 (6.35%) Nessus
7 4 (6.35%) WebInspect
8 2 (3.17%) Single Sign-On
9 1 (1.59%) CA Single Sign-On
9 1 (1.59%) Data Guard
Vendors
1 7 (11.11%) Atlassian
2 6 (9.52%) Google
2 6 (9.52%) Microsoft
2 6 (9.52%) Splunk
3 5 (7.94%) Apple
4 4 (6.35%) Checkmarx
4 4 (6.35%) Veracode
5 3 (4.76%) Oracle
6 2 (3.17%) F5
6 2 (3.17%) Red Hat
6 2 (3.17%) Sage
6 2 (3.17%) VMware
7 1 (1.59%) CA
7 1 (1.59%) Citrix
7 1 (1.59%) Databricks
7 1 (1.59%) Dell
7 1 (1.59%) Qualys
7 1 (1.59%) ServiceNow
7 1 (1.59%) Tanium
7 1 (1.59%) Zscaler