Azure Contracts in the North of England

Microsoft Azure
England > North of England

The table below provides summary statistics for contract job vacancies advertised in the North of England requiring Azure skills. It includes a benchmarking guide to the contractor rates offered in vacancies that cited Azure over the 6 months leading up to 1 May 2025, comparing them to the same period in the previous two years.

6 months to
1 May 2025
Same period 2024 Same period 2023
Rank 8 9 4
Rank change year-on-year +1 -5 0
Contract jobs citing Azure 401 514 953
As % of all contract jobs advertised in the North of England 12.17% 10.78% 16.35%
As % of the Cloud Services category 36.09% 36.51% 44.51%
Number of daily rates quoted 308 373 745
10th Percentile £263 £313 £363
25th Percentile £389 £413 £456
Median daily rate (50th Percentile) £475 £500 £525
Median % change year-on-year -5.00% -4.76% +5.00%
75th Percentile £563 £588 £600
90th Percentile £638 £650 £700
England median daily rate £525 £545 £563
% change year-on-year -3.67% -3.11% +2.27%
Number of hourly rates quoted 2 3 15
10th Percentile £67.63 £16.55 £16.85
25th Percentile £67.81 £17.00 £20.00
Median hourly rate £71.25 £18.50 £49.00
Median % change year-on-year +285.14% -62.24% +117.78%
75th Percentile £75.31 £32.72 £70.00
90th Percentile £75.88 £40.79 -
England median hourly rate £44.25 £35.00 £55.00
% change year-on-year +26.43% -36.36% +10.00%

All Cloud Skills
North of England

Azure falls under the Cloud Services category. For comparison with the information above, the following table provides summary statistics for all contract job vacancies requiring cloud computing skills in the North of England.

Contract vacancies with a requirement for cloud computing skills 1,111 1,408 2,141
As % of all contract IT jobs advertised in the North of England 33.72% 29.53% 36.73%
Number of daily rates quoted 838 999 1,595
10th Percentile £248 £263 £300
25th Percentile £385 £375 £425
Median daily rate (50th Percentile) £475 £475 £525
Median % change year-on-year - -9.52% +5.00%
75th Percentile £550 £575 £600
90th Percentile £638 £643 £688
England median daily rate £525 £525 £550
% change year-on-year - -4.55% -
Number of hourly rates quoted 24 79 37
10th Percentile £12.50 £13.00 £16.22
25th Percentile £26.72 £15.50 £20.00
Median hourly rate £30.91 £16.06 £39.60
Median % change year-on-year +92.43% -59.44% +111.93%
75th Percentile £73.44 £20.77 £65.00
90th Percentile £97.98 £43.75 £70.00
England median hourly rate £25.50 £20.77 £32.30
% change year-on-year +22.77% -35.70% +53.81%

Azure
Job Vacancy Trend in the North of England

Job postings citing Azure as a proportion of all IT jobs advertised in the North of England.
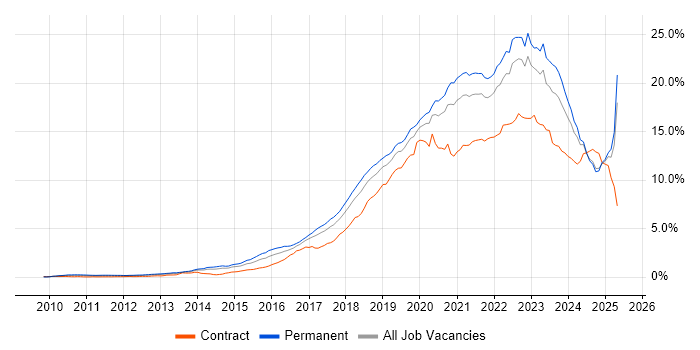
Job vacancy trend for Azure in the North of England

Azure
Contractor Daily Rate Trend in the North of England

3-month moving average daily rate quoted in jobs citing Azure in the North of England.

Daily rate trend for Azure in the North of England

Azure
Daily Rate Histogram in the North of England

Daily rate distribution for jobs citing Azure in the North of England over the 6 months to 1 May 2025.

Daily rate histogram for Azure in the North of England

Azure
Contractor Hourly Rate Trend in the North of England

3-month moving average hourly rates quoted in jobs citing Azure in the North of England.

Hourly rate trend for Azure in the North of England

Azure
Contract Job Locations in the North of England

The table below looks at the demand and provides a guide to the median contractor rates quoted in IT jobs citing Azure within the North of England region over the 6 months to 1 May 2025. The 'Rank Change' column provides an indication of the change in demand within each location based on the same 6 month period last year.

Location Rank Change
on Same Period
Last Year
Matching
Contract
IT Job Ads
Median
Daily Rate
Past 6 Months
Median Daily Rate
% Change
on Same Period
Last Year
Live
Jobs
North West +5 257 £500 - 518
Yorkshire -3 110 £425 -10.53% 247
North East -1 33 £506 -4.93% 106
Azure
England

Azure
Co-occurring Skills and Capabilities in the North of England by Category

The follow tables expand on the table above by listing co-occurrences grouped by category. The same employment type, locality and period is covered with up to 20 co-occurrences shown in each of the following categories:

Application Platforms
1 61 (15.21%) Microsoft Exchange
2 56 (13.97%) SharePoint
3 8 (2.00%) Apache Spark
4 6 (1.50%) Apache
4 6 (1.50%) Confluence
5 4 (1.00%) Camunda
5 4 (1.00%) SAS
6 3 (0.75%) Apache Airflow
6 3 (0.75%) CMS
6 3 (0.75%) nginx
6 3 (0.75%) WebSphere
7 2 (0.50%) BizTalk Server
7 2 (0.50%) Jupyter
7 2 (0.50%) WebSphere Application Server
8 1 (0.25%) Adobe Experience Manager
8 1 (0.25%) JBoss
8 1 (0.25%) Liferay
8 1 (0.25%) SharePoint Server
8 1 (0.25%) Sitecore CMS
8 1 (0.25%) Tomcat
Applications
1 18 (4.49%) Microsoft Office
2 9 (2.24%) Microsoft Excel
Business Applications
1 11 (2.74%) Dynamics CRM
2 7 (1.75%) SAP S/4HANA
3 5 (1.25%) Kondor
4 3 (0.75%) SAP ERP
5 2 (0.50%) Unit4 Business World
6 1 (0.25%) NetSuite
6 1 (0.25%) Remedy ITSM
6 1 (0.25%) Shopify
Cloud Services
1 106 (26.43%) Microsoft 365
2 101 (25.19%) AWS
3 92 (22.94%) Entra ID
4 68 (16.96%) GCP
5 49 (12.22%) Azure DevOps
6 47 (11.72%) Power Platform
7 30 (7.48%) Azure Data Factory
8 26 (6.48%) IaaS
9 21 (5.24%) SaaS
10 18 (4.49%) PaaS
11 16 (3.99%) Dynamics 365
12 15 (3.74%) OneDrive
13 13 (3.24%) PowerApps
14 12 (2.99%) Serverless
15 11 (2.74%) Azure Synapse Analytics
16 9 (2.24%) Cloud Computing
16 9 (2.24%) Microsoft Purview
17 8 (2.00%) Power Automate
17 8 (2.00%) Snowflake
18 7 (1.75%) Azure Sentinel
Communications & Networking
1 39 (9.73%) Firewall
2 22 (5.49%) DNS
3 19 (4.74%) Network Security
4 16 (3.99%) DHCP
5 14 (3.49%) VPN
6 11 (2.74%) Intrusion Detection
7 9 (2.24%) WAN
8 8 (2.00%) Wi-Fi
9 7 (1.75%) SAN
10 6 (1.50%) LAN
10 6 (1.50%) TCP/IP
11 5 (1.25%) VLAN
11 5 (1.25%) Wireless
12 4 (1.00%) NAS
12 4 (1.00%) Remote Desktop
12 4 (1.00%) SD-WAN
12 4 (1.00%) SSL
13 3 (0.75%) BGP
13 3 (0.75%) Internet
13 3 (0.75%) MPLS
Database & Business Intelligence
1 46 (11.47%) SQL Server
2 43 (10.72%) Power BI
3 22 (5.49%) Data Lake
4 18 (4.49%) Data Warehouse
5 13 (3.24%) PostgreSQL
6 11 (2.74%) Azure SQL Database
6 11 (2.74%) NoSQL
6 11 (2.74%) Relational Database
7 10 (2.49%) Metadata
7 10 (2.49%) MySQL
8 9 (2.24%) SQL Server Integration Services
9 8 (2.00%) MongoDB
10 7 (1.75%) Big Data
10 7 (1.75%) Tableau
11 6 (1.50%) Delta Lake
12 4 (1.00%) Hadoop
12 4 (1.00%) Metadata Repository
12 4 (1.00%) Neo4j
12 4 (1.00%) SQL Server Reporting Services
13 3 (0.75%) RDBMS
Development Applications
1 23 (5.74%) Git
2 22 (5.49%) JIRA
3 17 (4.24%) GitLab
4 14 (3.49%) Selenium
5 10 (2.49%) Jenkins
6 8 (2.00%) ERwin
7 7 (1.75%) Visual Studio
7 7 (1.75%) webpack
8 6 (1.50%) Postman
9 5 (1.25%) Babel
10 4 (1.00%) Cypress.io
10 4 (1.00%) JMeter
10 4 (1.00%) SoapUI
10 4 (1.00%) TestRail
11 3 (0.75%) Cucumber
11 3 (0.75%) ER Studio
11 3 (0.75%) Maven
11 3 (0.75%) SonarQube
11 3 (0.75%) SQL Server Management Studio (SSMS)
11 3 (0.75%) Visual Studio Code
General
1 85 (21.20%) Social Skills
2 56 (13.97%) Finance
3 52 (12.97%) Public Sector
4 34 (8.48%) Analytical Skills
5 21 (5.24%) Telecoms
6 19 (4.74%) Legal
7 16 (3.99%) Banking
8 15 (3.74%) Manufacturing
9 14 (3.49%) Retail
10 8 (2.00%) Marketing
10 8 (2.00%) Military
10 8 (2.00%) Pharmaceutical
11 3 (0.75%) Local Government
12 2 (0.50%) Documentation Skills
12 2 (0.50%) Electronics
12 2 (0.50%) French Language
12 2 (0.50%) Influencing Skills
13 1 (0.25%) Aviation
13 1 (0.25%) Inclusion and Diversity
13 1 (0.25%) Presentation Skills
Job Titles
1 56 (13.97%) Developer
2 52 (12.97%) Architect
3 38 (9.48%) Senior
4 33 (8.23%) Azure Engineer
5 32 (7.98%) Data Engineer
6 27 (6.73%) Microsoft 365 Engineer
7 25 (6.23%) Analyst
8 23 (5.74%) Infrastructure Engineer
8 23 (5.74%) Support Engineer
9 20 (4.99%) DevOps Engineer
10 19 (4.74%) Solutions Architect
11 14 (3.49%) Consultant
12 13 (3.24%) Cloud Engineer
13 12 (2.99%) IT Engineer
14 11 (2.74%) Azure DevOps Engineer
15 9 (2.24%) Azure Developer
15 9 (2.24%) React Developer
16 8 (2.00%) Azure Architect
16 8 (2.00%) Full-Stack Developer
16 8 (2.00%) Lead
Libraries, Frameworks & Software Standards
1 36 (8.98%) .NET
2 19 (4.74%) REST
3 17 (4.24%) RESTful
4 15 (3.74%) PySpark
5 14 (3.49%) React
6 13 (3.24%) Node.js
7 12 (2.99%) CSS
7 12 (2.99%) HTML
8 10 (2.49%) SOAP
9 9 (2.24%) AngularJS
10 8 (2.00%) ARM Templates
10 8 (2.00%) Kafka
10 8 (2.00%) pytest
11 7 (1.75%) .NET Core
11 7 (1.75%) ADO
12 6 (1.50%) HTML5
12 6 (1.50%) LDAP
12 6 (1.50%) TensorFlow
13 5 (1.25%) PyTorch
14 4 (1.00%) FastAPI
Miscellaneous
1 12 (2.99%) Hybrid Cloud
2 9 (2.24%) Cloud Native
2 9 (2.24%) Data Structures
2 9 (2.24%) Greenfield Project
3 8 (2.00%) Onboarding
4 7 (1.75%) Data Centre
4 7 (1.75%) Enterprise Software
5 6 (1.50%) Management Information System
5 6 (1.50%) Mobile App
6 5 (1.25%) Data Protection Act
6 5 (1.25%) Derivative
6 5 (1.25%) Foreign Exchange (FX)
6 5 (1.25%) Product Ownership
7 4 (1.00%) Algorithms
7 4 (1.00%) Driving Licence
7 4 (1.00%) Life Science
7 4 (1.00%) NHS
7 4 (1.00%) Self-Motivation
8 3 (0.75%) IoT
8 3 (0.75%) IVR
Operating Systems
1 79 (19.70%) Windows
2 52 (12.97%) Windows Server
3 41 (10.22%) Linux
4 15 (3.74%) VMS
5 14 (3.49%) Unix
6 12 (2.99%) Windows 10
7 10 (2.49%) Red Hat Enterprise Linux
8 9 (2.24%) Android
8 9 (2.24%) Windows Server 2016
9 7 (1.75%) Apple iOS
9 7 (1.75%) Windows Server 2019
10 4 (1.00%) AIX
10 4 (1.00%) Windows Server 2012
11 3 (0.75%) CentOS
11 3 (0.75%) Solaris
11 3 (0.75%) Ubuntu
12 2 (0.50%) HPUX
12 2 (0.50%) Windows 7
13 1 (0.25%) Mac OS
13 1 (0.25%) Windows Server 2003
Processes & Methodologies
1 92 (22.94%) DevOps
2 87 (21.70%) Problem-Solving
3 86 (21.45%) Agile
4 54 (13.47%) CI/CD
5 43 (10.72%) Data Modelling
6 41 (10.22%) Infrastructure Engineering
7 40 (9.98%) Business Intelligence
8 39 (9.73%) Analytics
8 39 (9.73%) Migration
9 32 (7.98%) ITIL
10 31 (7.73%) ETL
11 29 (7.23%) Collaborative Working
11 29 (7.23%) Software Engineering
12 28 (6.98%) High Availability
12 28 (6.98%) Microservices
13 27 (6.73%) Cybersecurity
13 27 (6.73%) Data Pipeline
14 25 (6.23%) ITSM
15 23 (5.74%) Containerisation
15 23 (5.74%) Project Delivery
Programming Languages
1 74 (18.45%) SQL
2 73 (18.20%) Python
3 44 (10.97%) PowerShell
4 28 (6.98%) C#
5 17 (4.24%) Java
6 16 (3.99%) JavaScript
7 15 (3.74%) Bash
8 7 (1.75%) T-SQL
9 6 (1.50%) Shell Script
10 4 (1.00%) Bicep
10 4 (1.00%) Perl
10 4 (1.00%) PHP
11 3 (0.75%) Data Analysis Expressions
11 3 (0.75%) R
11 3 (0.75%) Scala
11 3 (0.75%) TypeScript
12 2 (0.50%) ActionScript
12 2 (0.50%) ActionScript 2.0
12 2 (0.50%) PL/SQL
13 1 (0.25%) VBScript
Qualifications
1 68 (16.96%) Security Cleared
2 55 (13.72%) SC Cleared
3 35 (8.73%) Degree
4 31 (7.73%) Microsoft Certification
5 25 (6.23%) Azure Certification
6 13 (3.24%) Computer Science Degree
7 11 (2.74%) Cisco Certification
8 9 (2.24%) AWS Certification
9 8 (2.00%) Master's Degree
10 7 (1.75%) AWS Certified Solutions Architect
11 5 (1.25%) CCNA
11 5 (1.25%) MCSE
12 4 (1.00%) (ISC)2 CCSP
12 4 (1.00%) CISM
12 4 (1.00%) CISSP
12 4 (1.00%) DBS Check
12 4 (1.00%) VMware Certified Professional (VCP)
13 3 (0.75%) CCIE
13 3 (0.75%) CCNP
13 3 (0.75%) ITIL Foundation Certificate
Quality Assurance & Compliance
1 25 (6.23%) QA
2 20 (4.99%) Data Quality
3 14 (3.49%) GDPR
4 12 (2.99%) Accessibility
5 5 (1.25%) Basel III
5 5 (1.25%) California Consumer Privacy Act
5 5 (1.25%) MiFID
5 5 (1.25%) NIST
6 4 (1.00%) ISO/IEC 27001
6 4 (1.00%) PCI DSS
6 4 (1.00%) PMO
6 4 (1.00%) SLA
7 2 (0.50%) NCSC
7 2 (0.50%) Sarbanes-Oxley
8 1 (0.25%) COBIT
8 1 (0.25%) Cyber Essentials
8 1 (0.25%) Government Security Classifications
8 1 (0.25%) GRC
8 1 (0.25%) SOC 2
8 1 (0.25%) Software Quality Assurance
System Software
1 95 (23.69%) Active Directory
2 39 (9.73%) Docker
3 31 (7.73%) VMware Infrastructure
4 15 (3.74%) vSphere
5 9 (2.24%) Virtual Machines
6 6 (1.50%) VMware ESXi
7 5 (1.25%) BitLocker
7 5 (1.25%) Hyper-V
7 5 (1.25%) Virtual Desktop
8 4 (1.00%) Virtual Servers
9 3 (0.75%) Microsoft Virtual Server
10 2 (0.50%) KVM
10 2 (0.50%) VMware NSX
11 1 (0.25%) Apache ZooKeeper
11 1 (0.25%) Microsoft App-V
11 1 (0.25%) Veritas Cluster Server
Systems Management
1 56 (13.97%) Microsoft Intune
2 45 (11.22%) Kubernetes
3 38 (9.48%) Terraform
4 26 (6.48%) Single Sign-On
5 19 (4.74%) WSUS
6 15 (3.74%) Ansible
7 11 (2.74%) Grafana
8 10 (2.49%) Prometheus
9 9 (2.24%) Puppet
9 9 (2.24%) SCCM
10 7 (1.75%) Progress Chef
11 5 (1.25%) vCenter Server
12 4 (1.00%) Active Directory Federation Services
13 2 (0.50%) Docker Swarm
13 2 (0.50%) Istio
13 2 (0.50%) ZABBIX
14 1 (0.25%) Nagios
14 1 (0.25%) Nessus
14 1 (0.25%) NetBackup
14 1 (0.25%) SCOM
Vendors
1 174 (43.39%) Microsoft
2 51 (12.72%) VMware
3 38 (9.48%) Databricks
4 21 (5.24%) Google
5 16 (3.99%) Cisco
6 14 (3.49%) SAP
7 11 (2.74%) Oracle
8 10 (2.49%) Citrix
9 9 (2.24%) Red Hat
9 9 (2.24%) Virgin Media
10 8 (2.00%) IBM
11 7 (1.75%) Ariba
11 7 (1.75%) Meraki
12 6 (1.50%) CyberArk
12 6 (1.50%) Veeam
13 5 (1.25%) CheckPoint
13 5 (1.25%) Palo Alto
13 5 (1.25%) ServiceNow
13 5 (1.25%) Sybase
14 4 (1.00%) Talend