DevOps Contracts in Reading

DevOps
Berkshire > Reading

The table below provides summary statistics for contract job vacancies advertised in Reading requiring DevOps skills. It includes a benchmarking guide to the contractor rates offered in vacancies that cited DevOps over the 6 months leading up to 20 September 2024, comparing them to the same period in the previous two years.

6 months to
20 Sep 2024
Same period 2023 Same period 2022
Rank 8 9 13
Rank change year-on-year +1 +4 -6
Contract jobs citing DevOps 175 163 134
As % of all contract jobs advertised in Reading 15.91% 14.31% 9.35%
As % of the Processes & Methodologies category 18.48% 16.14% 10.61%
Number of daily rates quoted 136 135 95
10th Percentile £491 £500 £416
25th Percentile £525 £539 £478
Median daily rate (50th Percentile) £609 £600 £531
Median % change year-on-year +1.46% +13.10% +3.01%
75th Percentile £651 £675 £625
90th Percentile £675 £738 £650
Berkshire median daily rate £605 £600 £550
% change year-on-year +0.83% +9.09% +10.00%
Number of hourly rates quoted 4 2 1
Median hourly rate £87.46 £77.10 £75.75
Median % change year-on-year +13.44% +1.78% +59.47%
Berkshire median hourly rate £87.46 £75.67 £85.38
% change year-on-year +15.58% -11.37% +15.37%

All Process and Methodology Skills
Reading

DevOps falls under the Processes and Methodologies category. For comparison with the information above, the following table provides summary statistics for all contract job vacancies requiring process or methodology skills in Reading.

Contract vacancies with a requirement for process or methodology skills 947 1,010 1,263
As % of all contract IT jobs advertised in Reading 86.09% 88.67% 88.14%
Number of daily rates quoted 511 667 774
10th Percentile £350 £303 £311
25th Percentile £475 £425 £413
Median daily rate (50th Percentile) £580 £550 £500
Median % change year-on-year +5.45% +10.00% +5.26%
75th Percentile £650 £638 £625
90th Percentile £700 £700 £682
Berkshire median daily rate £550 £525 £500
% change year-on-year +4.76% +5.00% +8.11%
Number of hourly rates quoted 28 20 5
10th Percentile £14.50 £18.40 -
25th Percentile £51.93 £52.23 £21.25
Median hourly rate £61.33 £65.56 £34.89
Median % change year-on-year -6.46% +87.91% -25.37%
75th Percentile £75.40 £74.20 £51.50
90th Percentile £87.46 £75.42 £66.05
Berkshire median hourly rate £61.50 £60.00 £41.20
% change year-on-year +2.49% +45.65% +91.60%

DevOps
Job Vacancy Trend in Reading

Job postings citing DevOps as a proportion of all IT jobs advertised in Reading.
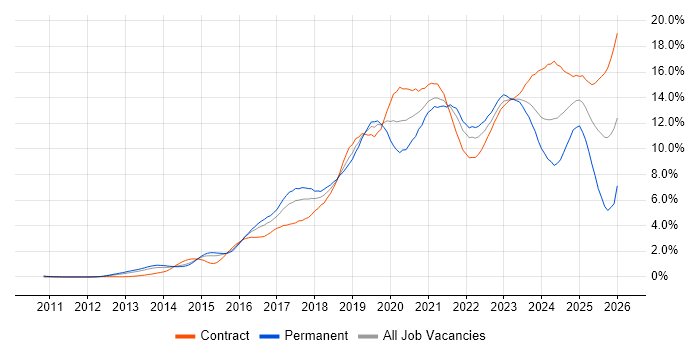
Job vacancy trend for DevOps in Reading

DevOps
Contractor Daily Rate Trend in Reading

3-month moving average daily rate quoted in jobs citing DevOps in Reading.

Daily rate trend for DevOps in Reading

DevOps
Daily Rate Histogram in Reading

Daily rate distribution for jobs citing DevOps in Reading over the 6 months to 20 September 2024.

Daily rate histogram for DevOps in Reading

DevOps
Contractor Hourly Rate Trend in Reading

3-month moving average hourly rates quoted in jobs citing DevOps in Reading.

Hourly rate trend for DevOps in Reading

DevOps
Co-occurring Skills and Capabilities in Reading by Category

The follow tables expand on the table above by listing co-occurrences grouped by category. The same employment type, locality and period is covered with up to 20 co-occurrences shown in each of the following categories:

Application Platforms
1 15 (8.57%) Microsoft Exchange
2 4 (2.29%) Oracle Workflow
3 3 (1.71%) Confluence
4 1 (0.57%) Appian
4 1 (0.57%) CMS
4 1 (0.57%) Headless CMS
4 1 (0.57%) JBoss
4 1 (0.57%) OpenStack
4 1 (0.57%) Red Hat Fuse
4 1 (0.57%) SharePoint
Applications
1 4 (2.29%) Microsoft Office
2 2 (1.14%) Microsoft Excel
Business Applications
1 4 (2.29%) Oracle EBS
1 4 (2.29%) Oracle EBS R12
1 4 (2.29%) Oracle Procure-to-Pay
2 1 (0.57%) Maximo
Cloud Services
1 115 (65.71%) Azure
2 54 (30.86%) Azure DevOps
3 51 (29.14%) Azure Monitor
4 39 (22.29%) Entra ID
5 37 (21.14%) Serverless
6 34 (19.43%) Azure Cosmos DB
7 33 (18.86%) Azure Data Factory
7 33 (18.86%) Azure Functions
8 31 (17.71%) AWS
9 20 (11.43%) Azure Storage
10 16 (9.14%) Microsoft 365
11 14 (8.00%) Azure Key Vault
12 13 (7.43%) Power Platform
13 10 (5.71%) Azure Service Bus
14 9 (5.14%) Azure API Management
14 9 (5.14%) OCI
15 7 (4.00%) PaaS
16 6 (3.43%) IaaS
17 5 (2.86%) PowerApps
17 5 (2.86%) SaaS
Communications & Networking
1 20 (11.43%) Firewall
2 16 (9.14%) DNS
3 15 (8.57%) DHCP
4 4 (2.29%) Intrusion Detection
5 3 (1.71%) Ethernet
5 3 (1.71%) SDH
6 2 (1.14%) 2G
6 2 (1.14%) 3G
6 2 (1.14%) 4G
7 1 (0.57%) FCAPS
7 1 (0.57%) Radio Access Network
7 1 (0.57%) VPN
Database & Business Intelligence
1 25 (14.29%) NoSQL
2 23 (13.14%) PostgreSQL
3 22 (12.57%) Oracle Database
4 20 (11.43%) Oracle Database 11g
5 9 (5.14%) Power BI
6 8 (4.57%) Data Warehouse
7 6 (3.43%) Azure SQL Database
8 5 (2.86%) Data Lake
8 5 (2.86%) Relational Database
9 4 (2.29%) Delta Lake
9 4 (2.29%) Oracle BI Publisher
9 4 (2.29%) Oracle Discoverer
9 4 (2.29%) Oracle Reports
9 4 (2.29%) SQLPlus
9 4 (2.29%) SSDT
10 3 (1.71%) Big Data
10 3 (1.71%) SQL Server
11 2 (1.14%) MySQL
11 2 (1.14%) RDBMS
11 2 (1.14%) Tableau
Development Applications
1 34 (19.43%) Git
2 28 (16.00%) Selenium
3 17 (9.71%) JIRA
4 6 (3.43%) Jenkins
4 6 (3.43%) Visual Studio
5 5 (2.86%) Cucumber
6 4 (2.29%) GitLab
6 4 (2.29%) Oracle Forms
6 4 (2.29%) REST Assured
6 4 (2.29%) SonarQube
7 2 (1.14%) SpecFlow
8 1 (0.57%) JMeter
8 1 (0.57%) JUnit
8 1 (0.57%) Maven
8 1 (0.57%) MSTest
8 1 (0.57%) NUnit
8 1 (0.57%) SoapUI
8 1 (0.57%) TeamCity
8 1 (0.57%) WebDriver
8 1 (0.57%) Xcode
General
1 39 (22.29%) Social Skills
2 38 (21.71%) Analytical Skills
3 13 (7.43%) Finance
4 7 (4.00%) Public Sector
4 7 (4.00%) Telecoms
5 4 (2.29%) Law
5 4 (2.29%) Legal
5 4 (2.29%) Police
6 3 (1.71%) Marketing
7 2 (1.14%) Billing
7 2 (1.14%) Presentation Skills
8 1 (0.57%) Banking
8 1 (0.57%) Electronics
8 1 (0.57%) Influencing Skills
8 1 (0.57%) Local Government
8 1 (0.57%) Manufacturing
8 1 (0.57%) Retail
Job Titles
1 47 (26.86%) Developer
2 25 (14.29%) Full-Stack Developer
3 23 (13.14%) Azure Developer
4 22 (12.57%) Azure Engineer
5 18 (10.29%) DevOps Engineer
6 17 (9.71%) Lead
7 16 (9.14%) Architect
8 15 (8.57%) Active Directory Support
9 14 (8.00%) Full-Stack Python Developer
9 14 (8.00%) Python Developer
10 13 (7.43%) Senior
11 12 (6.86%) Support Engineer
12 11 (6.29%) Active Directory Engineer
12 11 (6.29%) Active Directory Support Engineer
12 11 (6.29%) Analyst
13 8 (4.57%) Azure DevOps Engineer
14 7 (4.00%) Delivery Manager
14 7 (4.00%) Security Architect
14 7 (4.00%) Software Engineer
14 7 (4.00%) Solutions Architect
Libraries, Frameworks & Software Standards
1 25 (14.29%) React
2 23 (13.14%) ARM Templates
3 20 (11.43%) .NET
4 14 (8.00%) ADO
5 13 (7.43%) XML
6 10 (5.71%) AngularJS
7 9 (5.14%) .NET Framework
7 9 (5.14%) REST
8 8 (4.57%) Node.js
9 7 (4.00%) Entity Framework
9 7 (4.00%) HTML
10 5 (2.86%) CSS
10 5 (2.86%) GraphQL
10 5 (2.86%) JSON
10 5 (2.86%) YAML
11 4 (2.29%) Java EE
11 4 (2.29%) PySpark
11 4 (2.29%) PyTorch
11 4 (2.29%) RESTful
11 4 (2.29%) TensorFlow
Miscellaneous
1 27 (15.43%) Product Ownership
2 15 (8.57%) PKI
2 15 (8.57%) Self-Motivation
3 5 (2.86%) Data Protection Act
4 3 (1.71%) Algorithms
4 3 (1.71%) Greenfield Project
4 3 (1.71%) Public Cloud
4 3 (1.71%) Security Posture
4 3 (1.71%) Wiki
5 2 (1.14%) Cyberattack
5 2 (1.14%) Legacy Applications
5 2 (1.14%) Mobile Computing
5 2 (1.14%) Onboarding
5 2 (1.14%) Operational Technology
5 2 (1.14%) Virtual Team
6 1 (0.57%) Cloud Native
6 1 (0.57%) Distributed Systems
6 1 (0.57%) Low-Code
6 1 (0.57%) Mobile App
6 1 (0.57%) Social Media
Operating Systems
1 19 (10.86%) Linux
2 18 (10.29%) Windows
3 16 (9.14%) Windows Server
4 15 (8.57%) Windows Server 2016
4 15 (8.57%) Windows Server 2019
5 1 (0.57%) Android
5 1 (0.57%) Red Hat Enterprise Linux
Processes & Methodologies
1 104 (59.43%) Agile
2 71 (40.57%) CI/CD
3 45 (25.71%) Unit Testing
4 40 (22.86%) Scrum
5 34 (19.43%) Test Automation
6 31 (17.71%) Microservices
7 29 (16.57%) Infrastructure as Code
7 29 (16.57%) Migration
8 27 (15.43%) Analytics
8 27 (15.43%) SDLC
9 25 (14.29%) Clean Code
9 25 (14.29%) Full-Stack Development
10 23 (13.14%) Secure Coding
11 21 (12.00%) ITIL
12 20 (11.43%) Change Management
12 20 (11.43%) CRUD
12 20 (11.43%) Data Migration
12 20 (11.43%) Performance Tuning
13 19 (10.86%) Problem-Solving
14 18 (10.29%) Continuous Improvement
Programming Languages
1 45 (25.71%) SQL
2 43 (24.57%) Python
3 30 (17.14%) Java
4 29 (16.57%) C#
5 25 (14.29%) PowerShell
6 24 (13.71%) PL/SQL
7 17 (9.71%) Bicep
8 16 (9.14%) VBScript
9 15 (8.57%) VB
10 12 (6.86%) JavaScript
11 7 (4.00%) T-SQL
12 6 (3.43%) Kusto Query Language
13 5 (2.86%) C
14 4 (2.29%) PHP
15 3 (1.71%) C++
15 3 (1.71%) Delphi
15 3 (1.71%) R
15 3 (1.71%) Shell Script
16 1 (0.57%) Bash
16 1 (0.57%) VB.NET
Qualifications
1 57 (32.57%) Security Cleared
2 51 (29.14%) SC Cleared
3 21 (12.00%) Degree
4 20 (11.43%) DV Cleared
5 15 (8.57%) ITIL Foundation Certificate
6 4 (2.29%) PMP
7 1 (0.57%) Computer Science Degree
7 1 (0.57%) PMI Certification
Quality Assurance & Compliance
1 6 (3.43%) QA
2 4 (2.29%) Data Quality
2 4 (2.29%) GDPR
3 3 (1.71%) GRC
3 3 (1.71%) ISO/IEC 27001
3 3 (1.71%) NIST
4 1 (0.57%) Accessibility
4 1 (0.57%) MiFID
4 1 (0.57%) PCI DSS
4 1 (0.57%) SLA
System Software
1 39 (22.29%) Active Directory
2 16 (9.14%) Virtual Desktop
3 15 (8.57%) Virtual Machines
4 6 (3.43%) Docker
5 1 (0.57%) VMware Infrastructure
Systems Management
1 34 (19.43%) Kubernetes
2 17 (9.71%) Terraform
3 15 (8.57%) Active Directory Federation Services
3 15 (8.57%) Microsoft Intune
3 15 (8.57%) SCCM
3 15 (8.57%) SCOM
3 15 (8.57%) WSUS
4 8 (4.57%) Ansible
5 3 (1.71%) Docker Swarm
5 3 (1.71%) Podman
6 1 (0.57%) Grafana
6 1 (0.57%) Progress Chef
6 1 (0.57%) Prometheus
6 1 (0.57%) Puppet
Vendors
1 41 (23.43%) Microsoft
2 35 (20.00%) Oracle
3 4 (2.29%) Databricks
4 3 (1.71%) Ciena
4 3 (1.71%) Google
4 3 (1.71%) ServiceNow
5 2 (1.14%) Ericsson
5 2 (1.14%) Nokia
5 2 (1.14%) SAP
6 1 (0.57%) ArcSight
6 1 (0.57%) Cadence
6 1 (0.57%) IBM
6 1 (0.57%) TIBCO
6 1 (0.57%) Virgin Media
6 1 (0.57%) VMware