IBM Contract Job Trends in the South East

IBM
England > South East

The table below provides summary statistics for contract job vacancies advertised in the South East requiring knowledge or experience of IBM products and/or services. It includes a benchmarking guide to contractor rates offered in vacancies that cited IBM over the 6 months leading up to 7 November 2025, comparing them to the same period in the previous two years.

The figures below represent the IT contractor job market in general and are not representative of contractor rates within the International Business Machines Corporation.

6 months to
7 Nov 2025
Same period 2024 Same period 2023
Rank 137 114 158
Rank change year-on-year -23 +44 -2
Contract jobs citing IBM 41 67 54
As % of all contract jobs in the South East 1.06% 1.61% 1.00%
As % of the Vendors category 2.02% 3.24% 1.88%
Number of daily rates quoted 32 33 36
10th Percentile £414 £307 £400
25th Percentile £491 £380 £406
Median daily rate (50th Percentile) £556 £445 £475
Median % change year-on-year +25.00% -6.32% -13.64%
75th Percentile £707 £513 £691
90th Percentile £720 £785 £726
England median daily rate £513 £480 £550
% change year-on-year +6.77% -12.73% -
Number of hourly rates quoted 0 4 0
Median hourly rate - £28.00 -
England median hourly rate £25.15 £66.00 £70.00
% change year-on-year -61.89% -5.71% +27.27%

All Vendors
South East

IBM falls under the Vendor Products and Services category. For comparison with the information above, the following table provides summary statistics for all contract job vacancies requiring knowledge or experience of all vendor products and services in the South East.

Contract vacancies with a requirement for knowledge or experience of vendor products and services 2,028 2,066 2,879
As % of all contract IT jobs advertised in the South East 52.40% 49.56% 53.31%
Number of daily rates quoted 1,381 1,294 1,824
10th Percentile £206 £250 £205
25th Percentile £375 £403 £365
Median daily rate (50th Percentile) £500 £519 £513
Median % change year-on-year -3.62% +1.17% +2.55%
75th Percentile £588 £625 £606
90th Percentile £650 £688 £678
England median daily rate £506 £525 £525
% change year-on-year -3.62% - -2.33%
Number of hourly rates quoted 145 68 125
10th Percentile £14.20 £16.25 £15.50
25th Percentile £15.56 £25.31 £21.00
Median hourly rate £20.00 £57.65 £47.90
Median % change year-on-year -65.31% +20.36% +99.56%
75th Percentile £33.05 £67.14 £66.25
90th Percentile £81.00 £70.00 £76.53
England median hourly rate £25.00 £35.00 £44.50
% change year-on-year -28.57% -21.35% +73.08%

IBM
Job Vacancy Trend in the South East

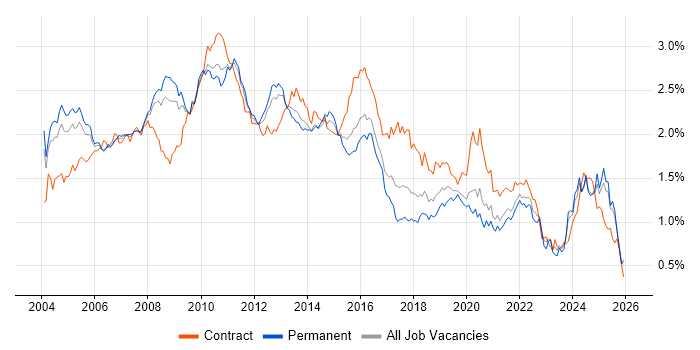
Historical trend showing the proportion of contract IT job postings citing IBM relative to all contract IT jobs advertised in the South East.

IBM job vacancy trend in the South East

IBM
Daily Rate Trend in the South East

Contractor daily rate distribution trend for jobs in the South East citing IBM.

Contractor daily rate distribution trend for jobs in the South East citing IBM

IBM
Daily Rate Histogram in the South East

Daily rate distribution for jobs citing IBM in the South East over the 6 months to 7 November 2025.

Daily rate histogram for IBM in the South East

IBM
Hourly Rate Trend in the South East

Contractor hourly rate distribution trend for jobs in the South East citing IBM.

Contractor hourly rate distribution trend for jobs in the South East citing IBM

IBM
Contract Job Locations in the South East

The table below looks at the demand and provides a guide to the median contractor rates quoted in IT jobs citing IBM within the South East region over the 6 months to 7 November 2025. The 'Rank Change' column provides an indication of the change in demand within each location based on the same 6 month period last year.

Location Rank Change
on Same Period
Last Year
Matching
Contract
IT Job Ads
Median
Daily Rate
Past 6 Months
Median Daily Rate
% Change
on Same Period
Last Year
Live
Jobs
Thames Valley +1 18 £488 +8.33% 18
Berkshire +12 17 £500 +11.11% 15
West Sussex -1 10 £720 -10.00% 5
Hampshire -23 10 £513 +22.02% 5
Surrey +1 2 £488 -32.76% 2
Buckinghamshire +9 1 £450 - 3
East Sussex - 1 - - 2
IBM
England

IBM
Co-Occurring Skills & Capabilities in the South East by Category

The following tables expand on the one above by listing co-occurrences grouped by category. They cover the same employment type, locality and period, with up to 20 co-occurrences shown in each category:
Application Platforms
1 10 (24.39%) ArcGIS
2 1 (2.44%) Anypoint
2 1 (2.44%) BizTalk Server
2 1 (2.44%) IIS
Business Applications
1 13 (31.71%) Maximo
2 2 (4.88%) Teamcenter
Cloud Services
1 7 (17.07%) AWS
1 7 (17.07%) AWS CloudFormation
2 6 (14.63%) AWS Lambda
2 6 (14.63%) OCI
2 6 (14.63%) Serverless
3 1 (2.44%) Amazon ECS
3 1 (2.44%) Amazon S3
3 1 (2.44%) GitHub
3 1 (2.44%) Rubrik
Communications & Networking
1 2 (4.88%) DWDM
1 2 (4.88%) SDH
2 1 (2.44%) Spanning Tree
2 1 (2.44%) VLAN
2 1 (2.44%) VSAN
Database & Business Intelligence
1 7 (17.07%) Amazon RDS
2 6 (14.63%) Amazon Redshift
2 6 (14.63%) Couchbase
2 6 (14.63%) GIS
2 6 (14.63%) NoSQL
3 1 (2.44%) Amazon Athena
3 1 (2.44%) DB2
3 1 (2.44%) PostgreSQL
3 1 (2.44%) SQL Server
Development Applications
1 8 (19.51%) Rational DOORS
2 5 (12.20%) Jenkins
3 4 (9.76%) JIRA
4 1 (2.44%) Bitbucket
4 1 (2.44%) Git
4 1 (2.44%) GitLab
General
1 12 (29.27%) Social Skills
2 8 (19.51%) Analytical Skills
2 8 (19.51%) Presentation Skills
3 4 (9.76%) Telecoms
4 2 (4.88%) Public Sector
5 1 (2.44%) Aerospace
5 1 (2.44%) Documentation Skills
5 1 (2.44%) Finance
Job Titles
1 13 (31.71%) Architect
2 11 (26.83%) Solutions Architect
3 6 (14.63%) Data Engineer
4 5 (12.20%) Developer
4 5 (12.20%) Platform Engineer
5 4 (9.76%) Maximo Architect
6 3 (7.32%) AWS Engineer
6 3 (7.32%) GIS Architect
6 3 (7.32%) Requirements Manager
7 2 (4.88%) Consultant
7 2 (4.88%) IT Manager
7 2 (4.88%) Systems Engineer
7 2 (4.88%) Telecoms Architect
8 1 (2.44%) Administrator
8 1 (2.44%) Analyst
8 1 (2.44%) Infrastructure Engineer
8 1 (2.44%) Integration Engineer
8 1 (2.44%) Linux Administrator
8 1 (2.44%) Linux Systems Administrator
8 1 (2.44%) Systems Administrator
Libraries, Frameworks & Software Standards
1 6 (14.63%) Kafka
2 1 (2.44%) .NET
2 1 (2.44%) .NET Framework
2 1 (2.44%) CSS
2 1 (2.44%) Flash
2 1 (2.44%) HTML
2 1 (2.44%) JSON
2 1 (2.44%) Middleware
2 1 (2.44%) REST
2 1 (2.44%) Web Services
Miscellaneous
1 11 (26.83%) Legacy Systems
2 7 (17.07%) Replication
3 2 (4.88%) CMDB
3 2 (4.88%) CSOC
3 2 (4.88%) Cyber Kill Chain
3 2 (4.88%) Data Centre
3 2 (4.88%) Distributed Architecture
3 2 (4.88%) Distributed Systems
3 2 (4.88%) Enterprise Software
3 2 (4.88%) Management Information System
4 1 (2.44%) AS400
4 1 (2.44%) Clustering
4 1 (2.44%) Data Protection Act
4 1 (2.44%) Legacy Applications
4 1 (2.44%) Onboarding
Operating Systems
1 8 (19.51%) Linux
2 6 (14.63%) Unix
3 2 (4.88%) Red Hat Enterprise Linux
3 2 (4.88%) Windows
4 1 (2.44%) CentOS
4 1 (2.44%) Ubuntu
4 1 (2.44%) VMS
4 1 (2.44%) Windows Server
Processes & Methodologies
1 13 (31.71%) Asset Management
1 13 (31.71%) Migration
2 12 (29.27%) Stakeholder Management
3 11 (26.83%) Problem-Solving
3 11 (26.83%) Roadmaps
4 7 (17.07%) High Availability
4 7 (17.07%) Infrastructure as Code
4 7 (17.07%) Performance Tuning
4 7 (17.07%) Platform Engineering
4 7 (17.07%) Stakeholder Engagement
4 7 (17.07%) Technology Roadmap
5 6 (14.63%) CI/CD
5 6 (14.63%) Security Patching
6 5 (12.20%) Cybersecurity
7 4 (9.76%) Agile
7 4 (9.76%) Requirements Engineering
7 4 (9.76%) Requirements Management
7 4 (9.76%) Security Operations
7 4 (9.76%) SIEM
7 4 (9.76%) Validation
Programming Languages
1 8 (19.51%) Python
2 5 (12.20%) Shell Script
3 4 (9.76%) JavaScript
4 2 (4.88%) SQL
5 1 (2.44%) Java
5 1 (2.44%) Jython
5 1 (2.44%) Perl
5 1 (2.44%) PowerShell
5 1 (2.44%) RPG
5 1 (2.44%) RPG IV
Qualifications
1 7 (17.07%) SC Cleared
1 7 (17.07%) Security Cleared
2 3 (7.32%) AWS Certification
2 3 (7.32%) Degree
3 2 (4.88%) CEH
3 2 (4.88%) DV Cleared
3 2 (4.88%) ECSA
3 2 (4.88%) GCFA
3 2 (4.88%) GCIA
3 2 (4.88%) GCIH
4 1 (2.44%) AWS Certified Solutions Architect
4 1 (2.44%) BPSS Clearance
4 1 (2.44%) Computer Science Degree
Quality Assurance & Compliance
1 2 (4.88%) ISO/IEC 19770
System Software
1 1 (2.44%) GPFS
1 1 (2.44%) Virtual Machines
1 1 (2.44%) VMware ESXi
1 1 (2.44%) VMware Infrastructure
1 1 (2.44%) vSphere
Systems Management
1 7 (17.07%) Terraform
2 1 (2.44%) Ansible
2 1 (2.44%) BladeLogic
2 1 (2.44%) NetBackup
2 1 (2.44%) QRadar
2 1 (2.44%) SCOM
2 1 (2.44%) vCenter Server
Vendors
1 7 (17.07%) ESRI
2 6 (14.63%) Confluent
3 4 (9.76%) Splunk
4 3 (7.32%) Microsoft
4 3 (7.32%) ServiceNow
5 2 (4.88%) Cisco
5 2 (4.88%) F5
5 2 (4.88%) Juniper
5 2 (4.88%) Nokia
5 2 (4.88%) Oracle
5 2 (4.88%) Palo Alto
5 2 (4.88%) Snow
6 1 (2.44%) 3PAR
6 1 (2.44%) Brocade
6 1 (2.44%) CrowdStrike
6 1 (2.44%) Dynatrace
6 1 (2.44%) Mellanox
6 1 (2.44%) MuleSoft
6 1 (2.44%) Nimble Storage
6 1 (2.44%) Solarflare