Azure Jobs in the Thames Valley

Microsoft Azure
South East > Thames Valley

The table below provides summary statistics for permanent job vacancies advertised in the Thames Valley requiring Azure skills. It includes a benchmarking guide to the annual salaries offered in vacancies that cited Azure over the 6 months leading up to 28 May 2025, comparing them to the same period in the previous two years.

6 months to
28 May 2025
Same period 2024 Same period 2023
Rank 12 7 4
Rank change year-on-year -5 -3 +2
Permanent jobs citing Azure 405 980 1,248
As % of all permanent jobs advertised in the Thames Valley 12.10% 14.15% 21.29%
As % of the Cloud Services category 50.12% 49.67% 55.25%
Number of salaries quoted 219 762 772
10th Percentile £36,000 £34,000 £30,750
25th Percentile £41,250 £41,250 £43,063
Median annual salary (50th Percentile) £55,000 £52,349 £60,000
Median % change year-on-year +5.06% -12.75% +3.90%
75th Percentile £78,750 £62,500 £75,000
90th Percentile £87,500 £76,125 £100,000
South East median annual salary £60,000 £55,000 £57,500
% change year-on-year +9.09% -4.35% -2.54%

All Cloud Skills
Thames Valley

Azure falls under the Cloud Services category. For comparison with the information above, the following table provides summary statistics for all permanent job vacancies requiring cloud computing skills in the Thames Valley.

Permanent vacancies with a requirement for cloud computing skills 808 1,973 2,259
As % of all permanent jobs advertised in the Thames Valley 24.14% 28.49% 38.54%
Number of salaries quoted 411 1,483 1,452
10th Percentile £31,250 £30,400 £30,500
25th Percentile £39,750 £37,500 £41,250
Median annual salary (50th Percentile) £55,000 £50,000 £57,500
Median % change year-on-year +10.00% -13.04% -
75th Percentile £71,500 £62,500 £75,000
90th Percentile £83,750 £76,250 £92,500
South East median annual salary £55,000 £50,000 £55,875
% change year-on-year +10.00% -10.51% +1.59%

Azure
Job Vacancy Trend in the Thames Valley

Job postings citing Azure as a proportion of all IT jobs advertised in the Thames Valley.
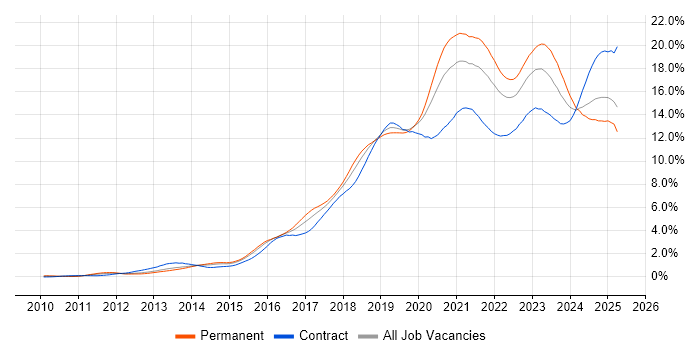
Job vacancy trend for Azure in the Thames Valley

Azure
Salary Trend in the Thames Valley

3-month moving average salary quoted in jobs citing Azure in the Thames Valley.

Salary trend for Azure in the Thames Valley

Azure
Salary Histogram in the Thames Valley

Salary distribution for jobs citing Azure in the Thames Valley over the 6 months to 28 May 2025.

Salary histogram for Azure in the Thames Valley

Azure
Job Locations in the Thames Valley

The table below looks at the demand and provides a guide to the median salaries quoted in IT jobs citing Azure within the Thames Valley region over the 6 months to 28 May 2025. The 'Rank Change' column provides an indication of the change in demand within each location based on the same 6 month period last year.

Location Rank Change
on Same Period
Last Year
Matching
Permanent
IT Job Ads
Median Salary
Past 6 Months
Median Salary
% Change
on Same Period
Last Year
Live
Jobs
Berkshire -3 252 £65,000 +23.81% 145
Buckinghamshire -25 82 £50,000 - 77
Oxfordshire -10 71 £47,500 -9.52% 81
Azure
South East

Azure
Co-occurring Skills and Capabilities in the Thames Valley by Category

The follow tables expand on the table above by listing co-occurrences grouped by category. The same employment type, locality and period is covered with up to 20 co-occurrences shown in each of the following categories:

Application Platforms
1 58 (14.32%) SharePoint
2 35 (8.64%) Microsoft Exchange
3 12 (2.96%) IBM Domino
4 9 (2.22%) Apache Spark
5 7 (1.73%) Confluence
6 5 (1.23%) Exchange Server 2013
7 4 (0.99%) CMS
8 2 (0.49%) IIS
9 1 (0.25%) OpenStack
9 1 (0.25%) Sitefinity
9 1 (0.25%) Umbraco
Applications
1 12 (2.96%) Microsoft Office
2 1 (0.25%) Microsoft Excel
2 1 (0.25%) Trello
Business Applications
1 2 (0.49%) Dynamics AX
2 1 (0.25%) Sage 200
Cloud Services
1 105 (25.93%) AWS
2 85 (20.99%) Microsoft 365
3 78 (19.26%) GCP
4 66 (16.30%) Azure DevOps
5 59 (14.57%) Power Platform
6 41 (10.12%) Entra ID
7 35 (8.64%) Power Automate
8 33 (8.15%) PowerApps
9 30 (7.41%) Azure Cosmos DB
10 28 (6.91%) Azure Service Bus
11 27 (6.67%) Snowflake
12 23 (5.68%) SonarCloud
13 20 (4.94%) Azure Data Factory
14 14 (3.46%) Azure Monitor
14 14 (3.46%) GitHub
15 13 (3.21%) Dynamics 365
15 13 (3.21%) SaaS
16 12 (2.96%) Azure Synapse Analytics
16 12 (2.96%) IaaS
17 10 (2.47%) PaaS
Communications & Networking
1 40 (9.88%) Firewall
2 25 (6.17%) WAN
3 21 (5.19%) DNS
4 19 (4.69%) DHCP
4 19 (4.69%) LAN
5 12 (2.96%) SAN
5 12 (2.96%) TCP/IP
6 10 (2.47%) VLAN
7 8 (1.98%) VPN
7 8 (1.98%) Wi-Fi
8 7 (1.73%) IP Telephony
9 6 (1.48%) Cisco IOS
9 6 (1.48%) SD-WAN
10 4 (0.99%) Intrusion Detection
10 4 (0.99%) Network Security
10 4 (0.99%) VoIP
11 2 (0.49%) Remote Desktop
11 2 (0.49%) Wireless
11 2 (0.49%) WLAN
12 1 (0.25%) iSCSI
Database & Business Intelligence
1 100 (24.69%) Data Lake
2 50 (12.35%) Data Warehouse
3 45 (11.11%) Power BI
4 42 (10.37%) SQL Server
5 35 (8.64%) Big Data
6 26 (6.42%) Tableau
7 25 (6.17%) Elasticsearch
8 24 (5.93%) Metadata
9 14 (3.46%) Data Mining
9 14 (3.46%) NoSQL
10 9 (2.22%) Hadoop
11 8 (1.98%) Amazon RDS
11 8 (1.98%) MySQL
11 8 (1.98%) PostgreSQL
12 6 (1.48%) MongoDB
13 5 (1.23%) SQL Server Integration Services
14 4 (0.99%) SQL Server Reporting Services
15 3 (0.74%) Azure SQL Database
15 3 (0.74%) Relational Database
16 1 (0.25%) SQL Server Analysis Services
Development Applications
1 35 (8.64%) Git
1 35 (8.64%) Visual Studio
2 23 (5.68%) MSBuild
2 23 (5.68%) Octopus Deploy
2 23 (5.68%) Team Foundation Server
3 17 (4.20%) JIRA
4 10 (2.47%) GitLab
5 7 (1.73%) Selenium
6 6 (1.48%) Bitbucket
6 6 (1.48%) Cucumber
6 6 (1.48%) Maven
6 6 (1.48%) SonarQube
6 6 (1.48%) Sonatype Nexus
7 4 (0.99%) Jenkins
8 3 (0.74%) JUnit
8 3 (0.74%) Mockito
9 2 (0.49%) Moq
9 2 (0.49%) SpecFlow
9 2 (0.49%) SQL Server Management Studio (SSMS)
10 1 (0.25%) CMake
General
1 138 (34.07%) Social Skills
2 135 (33.33%) Law
3 63 (15.56%) Analytical Skills
4 42 (10.37%) Finance
4 42 (10.37%) Retail
5 28 (6.91%) Influencing Skills
6 16 (3.95%) Inclusion and Diversity
7 11 (2.72%) Legal
8 8 (1.98%) Banking
9 6 (1.48%) Manufacturing
10 4 (0.99%) Marketing
11 3 (0.74%) Games
11 3 (0.74%) Organisational Skills
11 3 (0.74%) Presentation Skills
11 3 (0.74%) Public Sector
12 2 (0.49%) Pharmaceutical
13 1 (0.25%) Automotive
13 1 (0.25%) Health Technology
13 1 (0.25%) Publishing
13 1 (0.25%) Telecoms
Job Titles
1 106 (26.17%) Lead
2 86 (21.23%) Senior
3 45 (11.11%) Architect
4 38 (9.38%) Developer
5 30 (7.41%) Support Engineer
6 27 (6.67%) Technical Architect
7 24 (5.93%) IT Support
8 21 (5.19%) Analyst
9 18 (4.44%) IT Engineer
9 18 (4.44%) Software Engineer
10 17 (4.20%) IT Support Engineer
11 15 (3.70%) Infrastructure Engineer
12 13 (3.21%) Platform Engineer
12 13 (3.21%) Senior Manager
12 13 (3.21%) Support Technician
13 10 (2.47%) Azure Developer
14 9 (2.22%) Cloud Engineer
14 9 (2.22%) Data Analytics Director
14 9 (2.22%) IT Manager
14 9 (2.22%) Support Analyst
Libraries, Frameworks & Software Standards
1 61 (15.06%) .NET
2 41 (10.12%) CSS
3 40 (9.88%) ASP.NET
3 40 (9.88%) HTML
4 31 (7.65%) REST
5 29 (7.16%) React
6 28 (6.91%) XML
7 25 (6.17%) JSON
8 23 (5.68%) Bootstrap
8 23 (5.68%) gRPC
9 20 (4.94%) Kafka
10 14 (3.46%) AngularJS
11 12 (2.96%) .NET Framework
12 9 (2.22%) ASP.NET MVC
12 9 (2.22%) Hibernate
12 9 (2.22%) HTML5
12 9 (2.22%) Spring
12 9 (2.22%) Spring Boot
13 8 (1.98%) .NET Core
13 8 (1.98%) Redux
Miscellaneous
1 27 (6.67%) Analytical Mindset
1 27 (6.67%) Product Ownership
2 21 (5.19%) Cloud Native
3 20 (4.94%) Algorithms
4 14 (3.46%) Management Information System
5 9 (2.22%) Greenfield Project
5 9 (2.22%) PKI
6 8 (1.98%) Enterprise Software
6 8 (1.98%) Onboarding
7 7 (1.73%) NHS
7 7 (1.73%) Public Cloud
7 7 (1.73%) Replication
7 7 (1.73%) Security Posture
8 6 (1.48%) Data Structures
9 5 (1.23%) Data Centre
9 5 (1.23%) Legacy Systems
9 5 (1.23%) Self-Motivation
10 4 (0.99%) CCTV
10 4 (0.99%) Operational Technology
10 4 (0.99%) Video Conferencing
Operating Systems
1 82 (20.25%) Windows
2 40 (9.88%) Windows Server
3 25 (6.17%) Linux
3 25 (6.17%) Mac OS
4 11 (2.72%) Android
4 11 (2.72%) Windows 10
5 8 (1.98%) Apple iOS
6 7 (1.73%) Windows Server 2012
7 5 (1.23%) SUSE
7 5 (1.23%) SUSE Linux Enterprise Server
8 3 (0.74%) Unix
8 3 (0.74%) Windows Server 2016
9 1 (0.25%) Ubuntu
9 1 (0.25%) VMS
9 1 (0.25%) Windows Server 2019
Processes & Methodologies
1 144 (35.56%) Analytics
2 127 (31.36%) DevOps
3 124 (30.62%) Problem-Solving
4 106 (26.17%) Agile
5 89 (21.98%) Roadmaps
6 81 (20.00%) Business Intelligence
7 80 (19.75%) Data Science
8 78 (19.26%) Data Engineering
9 76 (18.77%) Data Governance
10 75 (18.52%) Data Management
11 66 (16.30%) Stakeholder Management
12 61 (15.06%) Machine Learning
13 60 (14.81%) Computer Science
14 59 (14.57%) CI/CD
15 57 (14.07%) Data Architecture
16 56 (13.83%) Data Modelling
17 55 (13.58%) Mentoring
18 52 (12.84%) Data Strategy
19 44 (10.86%) Microservices
20 41 (10.12%) Data Analytics
Programming Languages
1 101 (24.94%) SQL
2 63 (15.56%) Python
3 60 (14.81%) C#
4 56 (13.83%) JavaScript
5 29 (7.16%) PowerShell
6 17 (4.20%) Java
7 12 (2.96%) Bash
8 10 (2.47%) TypeScript
9 6 (1.48%) X++
10 4 (0.99%) RPG
11 3 (0.74%) C++
12 2 (0.49%) Apex Code
12 2 (0.49%) Bicep
12 2 (0.49%) Go
12 2 (0.49%) Rust
12 2 (0.49%) SOQL
13 1 (0.25%) PHP
13 1 (0.25%) T-SQL
13 1 (0.25%) VB.NET
13 1 (0.25%) VBScript
Qualifications
1 95 (23.46%) Degree
2 24 (5.93%) Computer Science Degree
3 23 (5.68%) Microsoft Certification
4 22 (5.43%) Security Cleared
5 20 (4.94%) Azure Certification
6 18 (4.44%) Master's Degree
6 18 (4.44%) SC Cleared
7 14 (3.46%) MCP
8 10 (2.47%) AWS Certification
9 9 (2.22%) A+ Certification
10 8 (1.98%) DBS Check
11 6 (1.48%) MCSE
11 6 (1.48%) Numerate Degree
11 6 (1.48%) VMware Certified Professional (VCP)
12 5 (1.23%) CCNA
12 5 (1.23%) CCNP
12 5 (1.23%) Cisco Certification
12 5 (1.23%) MCSA
13 3 (0.74%) DV Cleared
13 3 (0.74%) Network+ Certification
Quality Assurance & Compliance
1 61 (15.06%) Data Quality
2 37 (9.14%) GDPR
3 36 (8.89%) QA
4 31 (7.65%) Accessibility
5 13 (3.21%) ISO/IEC 27001
6 12 (2.96%) SLA
7 11 (2.72%) Cyber Essentials
8 9 (2.22%) California Consumer Privacy Act
9 7 (1.73%) Cyber Essentials PLUS
10 4 (0.99%) NIST
11 2 (0.49%) HIPAA
11 2 (0.49%) ISO 22301
11 2 (0.49%) SOC 2
12 1 (0.25%) CDISC
System Software
1 75 (18.52%) Active Directory
2 54 (13.33%) Docker
3 33 (8.15%) VMware Infrastructure
4 32 (7.90%) Hyper-V
5 14 (3.46%) VMware ESXi
6 8 (1.98%) Virtual Machines
7 7 (1.73%) Terminal Services
8 6 (1.48%) NFS
9 4 (0.99%) Virtual Desktop
10 2 (0.49%) VMware Workstation
10 2 (0.49%) vSphere
11 1 (0.25%) Microsoft Virtual Server
11 1 (0.25%) vCloud
11 1 (0.25%) Virtual Servers
Systems Management
1 31 (7.65%) Kubernetes
2 28 (6.91%) Microsoft Intune
2 28 (6.91%) Terraform
3 13 (3.21%) Ansible
4 10 (2.47%) Grafana
4 10 (2.47%) Prometheus
4 10 (2.47%) SCCM
5 8 (1.98%) Single Sign-On
6 5 (1.23%) FortiGate
7 4 (0.99%) vCenter Server
8 3 (0.74%) PaperCut
8 3 (0.74%) Puppet
8 3 (0.74%) WSUS
9 2 (0.49%) Failover Clustering
9 2 (0.49%) Kubespray
9 2 (0.49%) ZENworks
10 1 (0.25%) Argo
10 1 (0.25%) Graylog
10 1 (0.25%) PowerCLI
10 1 (0.25%) vRealize
Vendors
1 214 (52.84%) Microsoft
2 43 (10.62%) VMware
3 30 (7.41%) SAP
4 26 (6.42%) ServiceNow
5 23 (5.68%) Databricks
6 16 (3.95%) Google
7 15 (3.70%) Cisco
8 13 (3.21%) Apple
8 13 (3.21%) Salesforce
9 7 (1.73%) OpenAI
9 7 (1.73%) Veeam
10 6 (1.48%) Palo Alto
10 6 (1.48%) Solace
11 5 (1.23%) arcserve
11 5 (1.23%) Fortinet
11 5 (1.23%) Meraki
11 5 (1.23%) Sophos
12 4 (0.99%) Citrix
13 3 (0.74%) SolarWinds
14 2 (0.49%) Datto