Azure Contracts in the Thames Valley

Microsoft Azure
South East > Thames Valley

The table below provides summary statistics for contract job vacancies advertised in the Thames Valley requiring Azure skills. It includes a benchmarking guide to the contractor rates offered in vacancies that cited Azure over the 6 months leading up to 9 May 2025, comparing them to the same period in the previous two years.

6 months to
9 May 2025
Same period 2024 Same period 2023
Rank 4 8 6
Rank change year-on-year +4 -2 +5
Contract jobs citing Azure 277 335 444
As % of all contract jobs advertised in the Thames Valley 18.65% 12.68% 15.66%
As % of the Cloud Services category 55.73% 46.53% 52.42%
Number of daily rates quoted 189 256 345
10th Percentile £325 £381 £367
25th Percentile £413 £467 £481
Median daily rate (50th Percentile) £525 £575 £550
Median % change year-on-year -8.70% +4.55% -
75th Percentile £615 £625 £638
90th Percentile £675 £681 £725
South East median daily rate £525 £550 £560
% change year-on-year -4.55% -1.74% +6.62%
Number of hourly rates quoted 3 13 5
10th Percentile £38.70 £22.97 £56.10
25th Percentile £51.38 £56.50 £61.50
Median hourly rate £74.00 £58.30 £79.19
Median % change year-on-year +26.93% -26.38% +60.47%
75th Percentile £76.35 £61.60 -
90th Percentile £76.85 - -
South East median hourly rate £52.75 £38.50 £67.50
% change year-on-year +37.01% -42.96% +16.73%

All Cloud Skills
Thames Valley

Azure falls under the Cloud Services category. For comparison with the information above, the following table provides summary statistics for all contract job vacancies requiring cloud computing skills in the Thames Valley.

Contract vacancies with a requirement for cloud computing skills 497 720 847
As % of all contract IT jobs advertised in the Thames Valley 33.47% 27.26% 29.88%
Number of daily rates quoted 322 505 614
10th Percentile £300 £275 £315
25th Percentile £413 £413 £425
Median daily rate (50th Percentile) £503 £500 £538
Median % change year-on-year +0.55% -6.98% +7.50%
75th Percentile £600 £608 £625
90th Percentile £663 £683 £700
South East median daily rate £500 £500 £525
% change year-on-year - -4.76% +5.00%
Number of hourly rates quoted 15 30 20
10th Percentile £20.96 £15.99 £17.15
25th Percentile £28.05 £19.37 £20.75
Median hourly rate £32.05 £42.50 £26.58
Median % change year-on-year -24.59% +59.89% +26.57%
75th Percentile £47.15 £59.95 £59.25
90th Percentile £76.51 £61.60 £79.19
South East median hourly rate £28.00 £23.22 £23.08
% change year-on-year +20.61% +0.61% +8.46%

Azure
Job Vacancy Trend in the Thames Valley

Job postings citing Azure as a proportion of all IT jobs advertised in the Thames Valley.
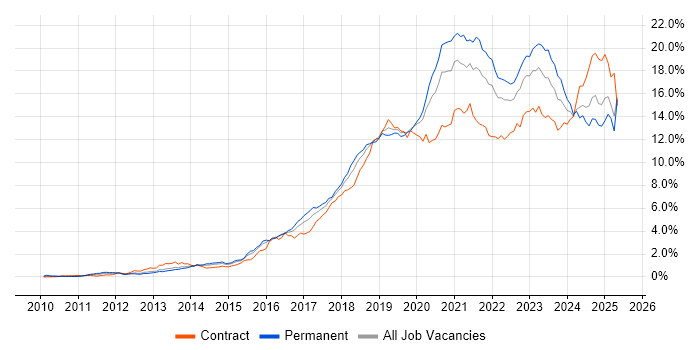
Job vacancy trend for Azure in the Thames Valley

Azure
Contractor Daily Rate Trend in the Thames Valley

3-month moving average daily rate quoted in jobs citing Azure in the Thames Valley.

Daily rate trend for Azure in the Thames Valley

Azure
Daily Rate Histogram in the Thames Valley

Daily rate distribution for jobs citing Azure in the Thames Valley over the 6 months to 9 May 2025.

Daily rate histogram for Azure in the Thames Valley

Azure
Contractor Hourly Rate Trend in the Thames Valley

3-month moving average hourly rates quoted in jobs citing Azure in the Thames Valley.

Hourly rate trend for Azure in the Thames Valley

Azure
Hourly Rate Histogram in the Thames Valley

Hourly rate distribution of jobs citing Azure in the Thames Valley over the 6 months to 9 May 2025.

Hourly rate histogram for Azure in the Thames Valley

Azure
Contract Job Locations in the Thames Valley

The table below looks at the demand and provides a guide to the median contractor rates quoted in IT jobs citing Azure within the Thames Valley region over the 6 months to 9 May 2025. The 'Rank Change' column provides an indication of the change in demand within each location based on the same 6 month period last year.

Location Rank Change
on Same Period
Last Year
Matching
Contract
IT Job Ads
Median
Daily Rate
Past 6 Months
Median Daily Rate
% Change
on Same Period
Last Year
Live
Jobs
Berkshire +2 224 £550 -8.33% 153
Buckinghamshire +8 36 £500 +8.11% 53
Oxfordshire -2 19 £380 -18.28% 73
Azure
South East

Azure
Co-occurring Skills and Capabilities in the Thames Valley by Category

The follow tables expand on the table above by listing co-occurrences grouped by category. The same employment type, locality and period is covered with up to 20 co-occurrences shown in each of the following categories:

Application Platforms
1 10 (3.61%) Apache Spark
2 8 (2.89%) SharePoint
3 5 (1.81%) Apache
3 5 (1.81%) IIS
3 5 (1.81%) Microsoft Exchange
4 4 (1.44%) Confluence
5 2 (0.72%) BizTalk Server
5 2 (0.72%) Camunda
6 1 (0.36%) CMS
6 1 (0.36%) Headless CMS
6 1 (0.36%) SAS
6 1 (0.36%) Umbraco
Applications
1 4 (1.44%) Microsoft Excel
1 4 (1.44%) Microsoft Office
2 2 (0.72%) Chatbot
3 1 (0.36%) Microsoft Project
3 1 (0.36%) MS Visio
Business Applications
1 2 (0.72%) Avolution ABACUS
2 1 (0.36%) Dynamics CRM
2 1 (0.36%) Infor CloudSuite
2 1 (0.36%) Oracle Applications
2 1 (0.36%) Oracle EBS
2 1 (0.36%) Oracle EBS R12
Cloud Services
1 84 (30.32%) AWS
2 73 (26.35%) Azure DevOps
3 34 (12.27%) GCP
4 32 (11.55%) Entra ID
5 28 (10.11%) Microsoft 365
6 27 (9.75%) Azure Data Factory
7 22 (7.94%) Azure Monitor
8 21 (7.58%) Power Platform
8 21 (7.58%) SaaS
9 20 (7.22%) Azure AKS
10 19 (6.86%) PaaS
11 17 (6.14%) GitHub
12 15 (5.42%) Azure API Management
13 14 (5.05%) IaaS
14 11 (3.97%) Serverless
15 10 (3.61%) Azure Service Bus
15 10 (3.61%) Azure Storage
15 10 (3.61%) Snowflake
16 9 (3.25%) Azure Cosmos DB
17 7 (2.53%) Azure Sentinel
Communications & Networking
1 18 (6.50%) DNS
2 13 (4.69%) TCP/IP
3 11 (3.97%) Firewall
3 11 (3.97%) MPLS
4 10 (3.61%) BGP
5 8 (2.89%) Network Security
5 8 (2.89%) SMTP
5 8 (2.89%) VLAN
5 8 (2.89%) VPN
6 7 (2.53%) DHCP
6 7 (2.53%) NetScaler
6 7 (2.53%) NGFW
6 7 (2.53%) SD-WAN
6 7 (2.53%) WAN
7 5 (1.81%) Cisco Nexus
7 5 (1.81%) OSPF
8 4 (1.44%) VSAN
9 3 (1.08%) Cisco ASA
9 3 (1.08%) FTP
9 3 (1.08%) Telnet
Database & Business Intelligence
1 20 (7.22%) Big Data
2 18 (6.50%) Azure SQL Database
2 18 (6.50%) Data Warehouse
3 13 (4.69%) Power BI
3 13 (4.69%) SQL Server
4 11 (3.97%) PostgreSQL
5 9 (3.25%) Data Lake
6 6 (2.17%) Hadoop
6 6 (2.17%) MySQL
7 5 (1.81%) Enterprise Data Warehouse
7 5 (1.81%) MongoDB
7 5 (1.81%) NoSQL
7 5 (1.81%) Relational Database
8 3 (1.08%) SSDT
8 3 (1.08%) Tableau
9 2 (0.72%) Amazon RDS
9 2 (0.72%) MS Access
9 2 (0.72%) RDBMS
9 2 (0.72%) Spark SQL
9 2 (0.72%) SQL Server Reporting Services
Development Applications
1 27 (9.75%) Git
2 23 (8.30%) Jenkins
2 23 (8.30%) Selenium
3 22 (7.94%) JIRA
4 16 (5.78%) GitLab
5 15 (5.42%) Cucumber
6 13 (4.69%) REST Assured
7 9 (3.25%) SonarQube
8 5 (1.81%) Postman
8 5 (1.81%) SpecFlow
9 4 (1.44%) Robot Framework
9 4 (1.44%) Vite
10 3 (1.08%) Cypress.io
11 2 (0.72%) Burp Suite
11 2 (0.72%) Metasploit
11 2 (0.72%) QARun
11 2 (0.72%) Snyk
11 2 (0.72%) Terragrunt
11 2 (0.72%) WinRunner
12 1 (0.36%) ERwin
General
1 82 (29.60%) Social Skills
2 47 (16.97%) Analytical Skills
3 30 (10.83%) Telecoms
4 27 (9.75%) Finance
5 16 (5.78%) Public Sector
6 9 (3.25%) Law
7 8 (2.89%) Manufacturing
8 7 (2.53%) Electronics
8 7 (2.53%) Marketing
9 5 (1.81%) Billing
9 5 (1.81%) Retail
10 4 (1.44%) Legal
10 4 (1.44%) Organisational Skills
10 4 (1.44%) Police
11 3 (1.08%) Automotive
12 2 (0.72%) Documentation Skills
12 2 (0.72%) Financial Institution
12 2 (0.72%) General Ledger
13 1 (0.36%) Influencing Skills
13 1 (0.36%) Presentation Skills
Job Titles
1 53 (19.13%) Architect
2 51 (18.41%) Developer
3 31 (11.19%) Azure Engineer
4 23 (8.30%) Senior
5 22 (7.94%) DevOps Engineer
6 18 (6.50%) Analyst
7 17 (6.14%) Azure DevOps Engineer
7 17 (6.14%) React Developer
7 17 (6.14%) Solutions Architect
8 16 (5.78%) Azure Developer
9 15 (5.42%) Data Engineer
10 14 (5.05%) Software Engineer
11 11 (3.97%) Consultant
11 11 (3.97%) Tester
12 10 (3.61%) Full-Stack Developer
13 9 (3.25%) Java Engineer
13 9 (3.25%) Java Software Engineer
13 9 (3.25%) Support Engineer
14 8 (2.89%) Lead
14 8 (2.89%) Security Architect
Libraries, Frameworks & Software Standards
1 26 (9.39%) .NET
2 21 (7.58%) REST
3 19 (6.86%) CSS
3 19 (6.86%) HTML
3 19 (6.86%) React
4 16 (5.78%) ARM Templates
5 14 (5.05%) ADO
6 13 (4.69%) Java EE
7 10 (3.61%) OAuth
7 10 (3.61%) PySpark
8 9 (3.25%) .NET Core
8 9 (3.25%) RESTful
9 8 (2.89%) Web Services
10 7 (2.53%) JSON
10 7 (2.53%) Node.js
10 7 (2.53%) SAML
11 6 (2.17%) GraphQL
11 6 (2.17%) Kafka
12 5 (1.81%) YAML
13 4 (1.44%) AngularJS
Miscellaneous
1 14 (5.05%) Cloud Native
2 13 (4.69%) Legacy Systems
3 12 (4.33%) Hybrid Cloud
3 12 (4.33%) PKI
3 12 (4.33%) Public Cloud
4 11 (3.97%) Self-Motivation
5 8 (2.89%) Onboarding
6 6 (2.17%) Product Ownership
6 6 (2.17%) Security Posture
7 5 (1.81%) Clustering
7 5 (1.81%) Renewable Energy
8 4 (1.44%) Cyber Threat
8 4 (1.44%) Data Centre
8 4 (1.44%) Data Protection Act
8 4 (1.44%) Management Information System
9 3 (1.08%) Algorithms
9 3 (1.08%) Analytical Mindset
9 3 (1.08%) CSOC
9 3 (1.08%) Mobile App
9 3 (1.08%) Operational Technology
Operating Systems
1 37 (13.36%) Windows
2 19 (6.86%) Windows Server
3 15 (5.42%) Linux
4 5 (1.81%) Ubuntu
4 5 (1.81%) Windows Server 2003
5 3 (1.08%) Unix
5 3 (1.08%) Windows 10
5 3 (1.08%) Windows Server 2019
6 2 (0.72%) Red Hat Enterprise Linux
6 2 (0.72%) Windows Server 2016
7 1 (0.36%) Android
7 1 (0.36%) Apple iOS
7 1 (0.36%) Mac OS
7 1 (0.36%) VMS
Processes & Methodologies
1 113 (40.79%) DevOps
2 79 (28.52%) Problem-Solving
3 56 (20.22%) Agile
4 52 (18.77%) CI/CD
5 45 (16.25%) Test Automation
6 35 (12.64%) Infrastructure as Code
7 34 (12.27%) Containerisation
8 32 (11.55%) Continuous Integration
8 32 (11.55%) Migration
9 31 (11.19%) Artificial Intelligence
10 28 (10.11%) Microservices
11 24 (8.66%) Analytics
11 24 (8.66%) Business Intelligence
11 24 (8.66%) Configuration Management
12 23 (8.30%) Decision-Making
13 22 (7.94%) ETL
13 22 (7.94%) Software Engineering
14 18 (6.50%) RBAC
14 18 (6.50%) Site Reliability Engineering
14 18 (6.50%) TOGAF
Programming Languages
1 70 (25.27%) Python
2 58 (20.94%) SQL
3 37 (13.36%) PowerShell
4 29 (10.47%) C#
5 28 (10.11%) Java
6 16 (5.78%) JavaScript
7 15 (5.42%) Bash
8 14 (5.05%) Bicep
9 9 (3.25%) TypeScript
10 5 (1.81%) Shell Script
11 4 (1.44%) T-SQL
11 4 (1.44%) VB
12 3 (1.08%) C
13 2 (0.72%) C++
13 2 (0.72%) Kusto Query Language
13 2 (0.72%) Ruby
14 1 (0.36%) Kotlin
14 1 (0.36%) Scala
14 1 (0.36%) X++
14 1 (0.36%) XMLA
Qualifications
1 62 (22.38%) Security Cleared
2 55 (19.86%) SC Cleared
3 21 (7.58%) Degree
4 16 (5.78%) Microsoft Certification
5 14 (5.05%) Azure Certification
6 12 (4.33%) CISSP
7 10 (3.61%) Cisco Certification
8 9 (3.25%) CCNP
8 9 (3.25%) CISM
9 8 (2.89%) DV Cleared
9 8 (2.89%) MCSE
10 6 (2.17%) Computer Science Degree
11 5 (1.81%) GIAC
12 4 (1.44%) AWS Certification
12 4 (1.44%) Master's Degree
13 3 (1.08%) AWS Certified Solutions Architect
13 3 (1.08%) OSCP
13 3 (1.08%) PMI Certification
13 3 (1.08%) PMP
13 3 (1.08%) VMware Certified Professional (VCP)
Quality Assurance & Compliance
1 15 (5.42%) GDPR
2 14 (5.05%) NIST
3 10 (3.61%) NCSC
4 8 (2.89%) HIPAA
5 7 (2.53%) Data Quality
5 7 (2.53%) QA
6 6 (2.17%) Cyber Essentials
6 6 (2.17%) ISO/IEC 27001
6 6 (2.17%) SLA
7 5 (1.81%) PCI DSS
8 3 (1.08%) Accessibility
9 2 (0.72%) WCAG
10 1 (0.36%) Actionable Recommendations
10 1 (0.36%) HL7
10 1 (0.36%) NIST 800
10 1 (0.36%) SNOMED CT
System Software
1 37 (13.36%) Active Directory
2 22 (7.94%) Docker
3 13 (4.69%) VMware Infrastructure
4 7 (2.53%) XenApp
5 6 (2.17%) VMware NSX
5 6 (2.17%) vSphere
5 6 (2.17%) XenDesktop
6 5 (1.81%) Virtual Machines
7 3 (1.08%) NFS
8 2 (0.72%) Hyper-V
8 2 (0.72%) Virtual Desktop
9 1 (0.36%) Apache Flume
9 1 (0.36%) VMware ESXi
Systems Management
1 38 (13.72%) Terraform
2 35 (12.64%) Kubernetes
3 25 (9.03%) Ansible
4 14 (5.05%) Microsoft Intune
5 9 (3.25%) Docker Swarm
5 9 (3.25%) Podman
6 7 (2.53%) SCCM
7 6 (2.17%) WSUS
8 5 (1.81%) Microsoft Clustering
8 5 (1.81%) Puppet
8 5 (1.81%) Single Sign-On
9 4 (1.44%) Prometheus
10 3 (1.08%) Active Directory Federation Services
10 3 (1.08%) Grafana
10 3 (1.08%) SCOM
11 2 (0.72%) Progress Chef
11 2 (0.72%) QRadar
12 1 (0.36%) Amdocs OSS
12 1 (0.36%) CASB
12 1 (0.36%) FortiGate
Vendors
1 86 (31.05%) Microsoft
2 23 (8.30%) Databricks
3 22 (7.94%) VMware
4 12 (4.33%) OpenAI
5 11 (3.97%) Cisco
6 10 (3.61%) Citrix
7 8 (2.89%) Salesforce
7 8 (2.89%) SAP
7 8 (2.89%) Virgin Media
8 7 (2.53%) Google
8 7 (2.53%) Oracle
8 7 (2.53%) Palo Alto
9 5 (1.81%) Dell
9 5 (1.81%) HP
9 5 (1.81%) ServiceNow
10 4 (1.44%) Splunk
11 3 (1.08%) CyberArk
11 3 (1.08%) IBM
11 3 (1.08%) UiPath
12 2 (0.72%) Spotify