Software Engineering Jobs in Bristol

Software Engineering
South West > Bristol

The following table provides summary statistics for permanent job vacancies advertised in Bristol with a requirement for Software Engineering skills. Included is a benchmarking guide to the salaries offered in vacancies that have cited Software Engineering over the 6 months to 8 May 2024 with a comparison to the same period in the previous 2 years.

6 months to
8 May 2024
Same period 2023 Same period 2022
Rank 7 17 5
Rank change year-on-year +10 -12 +2
Permanent jobs citing Software Engineering 453 359 623
As % of all permanent jobs advertised in Bristol 14.51% 13.70% 18.90%
As % of the Processes & Methodologies category 16.47% 14.33% 19.41%
Number of salaries quoted 369 239 367
10th Percentile £42,500 £42,250 £40,000
25th Percentile £50,000 £52,500 £46,250
Median annual salary (50th Percentile) £57,500 £65,000 £60,000
Median % change year-on-year -11.54% +8.33% +9.09%
75th Percentile £71,250 £83,750 £76,520
90th Percentile £85,000 £102,500 £88,000
South West median annual salary £55,000 £60,000 £57,500
% change year-on-year -8.33% +4.35% +9.52%

All Process and Methodology Skills
Bristol

Software Engineering is in the Processes and Methodologies category. The following table is for comparison with the above and provides summary statistics for all permanent job vacancies advertised in Bristol with a requirement for process or methodology skills.

Permanent vacancies with a requirement for process or methodology skills 2,751 2,506 3,209
As % of all permanent jobs advertised in Bristol 88.14% 95.61% 97.36%
Number of salaries quoted 2,064 1,479 2,164
10th Percentile £33,825 £34,528 £32,000
25th Percentile £45,000 £43,750 £41,250
Median annual salary (50th Percentile) £58,000 £59,526 £53,112
Median % change year-on-year -2.56% +12.08% +11.81%
75th Percentile £72,500 £73,750 £72,500
90th Percentile £87,500 £87,500 £85,000
South West median annual salary £51,000 £52,500 £50,000
% change year-on-year -2.86% +5.00% +7.53%

Software Engineering
Job Vacancy Trend in Bristol

Job postings citing Software Engineering as a proportion of all IT jobs advertised in Bristol.
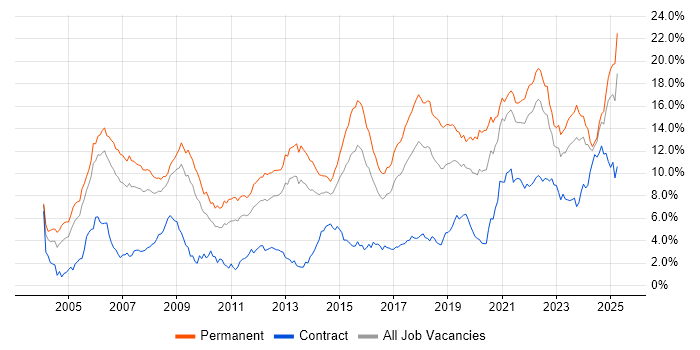
Job vacancy trend for Software Engineering in Bristol

Software Engineering
Salary Trend in Bristol

3-month moving average salary quoted in jobs citing Software Engineering in Bristol.

Salary trend for Software Engineering in Bristol

Software Engineering
Salary Histogram in Bristol

Salary distribution for jobs citing Software Engineering in Bristol over the 6 months to 8 May 2024.

Salary histogram for Software Engineering in Bristol

Software Engineering
Co-occurring Skills and Capabilities in Bristol by Category

The follow tables expand on the table above by listing co-occurrences grouped by category. The same employment type, locality and period is covered with up to 20 co-occurrences shown in each of the following categories:

Application Platforms
1 27 (5.96%) ArcGIS
1 27 (5.96%) GeoServer
2 4 (0.88%) Apache Spark
3 3 (0.66%) Captiva
3 3 (0.66%) Confluence
3 3 (0.66%) FileNet
3 3 (0.66%) WebSphere
4 2 (0.44%) JBoss
4 2 (0.44%) Red Hat Fuse
5 1 (0.22%) Adobe Experience Manager
5 1 (0.22%) CMS
5 1 (0.22%) Umbraco
Applications
1 3 (0.66%) Microsoft Office
Business Applications
1 2 (0.44%) SAP FI-GL
1 2 (0.44%) Teamcenter
Cloud Services
1 93 (20.53%) AWS
2 78 (17.22%) Azure
3 25 (5.52%) SaaS
4 20 (4.42%) GCP
5 17 (3.75%) Azure DevOps
5 17 (3.75%) Serverless
6 11 (2.43%) GitHub
7 8 (1.77%) Azure Functions
7 8 (1.77%) npm
8 5 (1.10%) Dynamics 365
8 5 (1.10%) OpenShift
9 4 (0.88%) Cloud Computing
9 4 (0.88%) OCI
10 3 (0.66%) Amazon EC2
11 2 (0.44%) Amazon S3
11 2 (0.44%) AWS Lambda
12 1 (0.22%) AWS CloudFormation
12 1 (0.22%) GitHub Actions
12 1 (0.22%) WhatsApp
Communications & Networking
1 7 (1.55%) Wi-Fi
2 6 (1.32%) Wireless
3 5 (1.10%) Bluetooth
4 2 (0.44%) 3GPP
4 2 (0.44%) 5G
4 2 (0.44%) AMQP
4 2 (0.44%) HTTP
4 2 (0.44%) Internet
4 2 (0.44%) Network Security
4 2 (0.44%) RS-232
4 2 (0.44%) TCP/IP
5 1 (0.22%) OFDM
5 1 (0.22%) Software-Defined Radio
5 1 (0.22%) ZigBee
Database & Business Intelligence
1 42 (9.27%) PostgreSQL
2 27 (5.96%) GIS
2 27 (5.96%) QGIS
3 21 (4.64%) SQL Server
4 17 (3.75%) Relational Database
5 14 (3.09%) MySQL
6 13 (2.87%) Big Data
7 7 (1.55%) NoSQL
7 7 (1.55%) Oracle Database
8 6 (1.32%) RDBMS
9 4 (0.88%) BigQuery
9 4 (0.88%) Data Lake
9 4 (0.88%) Data Warehouse
9 4 (0.88%) Flink
9 4 (0.88%) Hadoop
9 4 (0.88%) Oracle ODI
9 4 (0.88%) SQLite
10 3 (0.66%) InfluxDB
11 2 (0.44%) Amazon RDS
12 1 (0.22%) Azure SQL Database
Development Applications
1 59 (13.02%) Git
2 22 (4.86%) Jenkins
3 19 (4.19%) Rational Rhapsody
4 14 (3.09%) Oracle Forms
5 12 (2.65%) Visual Studio
6 10 (2.21%) GitLab
6 10 (2.21%) JIRA
7 5 (1.10%) Maven
8 4 (0.88%) Cypress.io
8 4 (0.88%) IBM UrbanCode
8 4 (0.88%) MSTest
8 4 (0.88%) NUnit
8 4 (0.88%) Sonatype Nexus
9 3 (0.66%) JDeveloper
9 3 (0.66%) Storybook
9 3 (0.66%) Team Foundation Server
10 2 (0.44%) IntelliJ
10 2 (0.44%) Rational DOORS
11 1 (0.22%) Cucumber
11 1 (0.22%) Selenium
General
1 72 (15.89%) Social Skills
2 68 (15.01%) Finance
3 36 (7.95%) Banking
4 26 (5.74%) Automotive
5 24 (5.30%) Aerospace
6 21 (4.64%) Analytical Skills
7 17 (3.75%) Aviation
7 17 (3.75%) Electronics
8 15 (3.31%) Manufacturing
9 14 (3.09%) Marketing
9 14 (3.09%) Telecoms
10 13 (2.87%) Retail
11 9 (1.99%) Tech for Good
12 7 (1.55%) Pharmaceutical
13 6 (1.32%) Financial Institution
13 6 (1.32%) Public Sector
14 5 (1.10%) Inclusion and Diversity
14 5 (1.10%) Presentation Skills
15 4 (0.88%) Documentation Skills
15 4 (0.88%) Influencing Skills
Job Titles
1 321 (70.86%) Software Engineer
2 131 (28.92%) Senior
3 106 (23.40%) Senior Software Engineer
4 88 (19.43%) Developer
5 84 (18.54%) Embedded Engineer
6 81 (17.88%) Embedded Software Engineer
7 43 (9.49%) C++ Software Engineer
7 43 (9.49%) Software Developer
8 33 (7.28%) Senior Embedded Engineer
9 32 (7.06%) Lead
9 32 (7.06%) Senior Embedded Software Engineer
10 30 (6.62%) Embedded C++ Engineer
10 30 (6.62%) Embedded C++ Software Engineer
11 22 (4.86%) Java Engineer
12 21 (4.64%) Senior C++ Software Engineer
13 17 (3.75%) Java Developer
13 17 (3.75%) Java Software Engineer
13 17 (3.75%) Lead Software Engineer
14 15 (3.31%) Developer/Software Engineer
14 15 (3.31%) Senior Developer
Libraries, Frameworks & Software Standards
1 95 (20.97%) React
2 81 (17.88%) .NET
3 46 (10.15%) .NET Core
3 46 (10.15%) CSS
4 39 (8.61%) Node.js
5 32 (7.06%) AngularJS
6 30 (6.62%) Spring
7 27 (5.96%) HTML
7 27 (5.96%) Leaflet
7 27 (5.96%) OpenLayers
7 27 (5.96%) PostGIS
8 25 (5.52%) REST
9 23 (5.08%) .NET Framework
9 23 (5.08%) Vue
10 21 (4.64%) Spring Boot
11 20 (4.42%) Kafka
11 20 (4.42%) Middleware
12 18 (3.97%) Laravel
13 16 (3.53%) Hibernate
13 16 (3.53%) JSON
Miscellaneous
1 37 (8.17%) Self-Motivation
2 22 (4.86%) Product Ownership
3 17 (3.75%) Mobile App
4 12 (2.65%) Cloud Native
5 11 (2.43%) Algorithms
5 11 (2.43%) Private Cloud
6 10 (2.21%) Greenfield Project
7 9 (1.99%) IoT
7 9 (1.99%) Public Cloud
8 6 (1.32%) Blockchain
8 6 (1.32%) Embedded Systems
9 5 (1.10%) Robotics
10 4 (0.88%) Data Structures
11 3 (0.66%) ARM Cortex
11 3 (0.66%) DataPower
11 3 (0.66%) Distributed Systems
11 3 (0.66%) Legacy Systems
11 3 (0.66%) Onboarding
11 3 (0.66%) Verilog
11 3 (0.66%) Virtual Team
Operating Systems
1 42 (9.27%) Linux
2 30 (6.62%) Windows
3 19 (4.19%) Apple iOS
4 11 (2.43%) Ubuntu
5 6 (1.32%) Embedded Linux
6 5 (1.10%) Android
7 3 (0.66%) Unix
8 1 (0.22%) Windows Embedded Compact
Processes & Methodologies
1 155 (34.22%) Agile
2 100 (22.08%) DevOps
3 73 (16.11%) Problem-Solving
4 51 (11.26%) Web Development
5 46 (10.15%) Actionable Insight
5 46 (10.15%) CI/CD
6 43 (9.49%) Microservices
7 39 (8.61%) Full Stack Development
8 37 (8.17%) Continuous Integration
8 37 (8.17%) Mentoring
9 35 (7.73%) Computer Science
10 33 (7.28%) OO
11 31 (6.84%) Test Automation
12 28 (6.18%) Scrum
13 26 (5.74%) Design Patterns
13 26 (5.74%) Open Source
13 26 (5.74%) User Experience
14 25 (5.52%) UML
15 24 (5.30%) Collaborative Culture
16 23 (5.08%) Fintech
Programming Languages
1 106 (23.40%) JavaScript
2 101 (22.30%) Java
3 90 (19.87%) C#
4 84 (18.54%) Python
5 67 (14.79%) C++
6 44 (9.71%) C
7 41 (9.05%) Ada
7 41 (9.05%) TypeScript
8 37 (8.17%) SQL
9 17 (3.75%) PHP
10 14 (3.09%) Go
11 11 (2.43%) Embedded C
12 8 (1.77%) Bash
12 8 (1.77%) Rust
13 7 (1.55%) Ruby
14 6 (1.32%) Swift
15 5 (1.10%) Kotlin
15 5 (1.10%) PowerShell
15 5 (1.10%) Shell Script
16 4 (0.88%) Scala
Qualifications
1 98 (21.63%) Security Cleared
2 49 (10.82%) SC Cleared
3 48 (10.60%) Degree
4 42 (9.27%) BPSS Clearance
5 9 (1.99%) Computer Science Degree
6 8 (1.77%) DV Cleared
7 2 (0.44%) PMI Certification
8 1 (0.22%) Master's Degree
8 1 (0.22%) Microsoft Certification
Quality Assurance & Compliance
1 9 (1.99%) Def Stans
2 8 (1.77%) IEC 61508
3 7 (1.55%) MISRA
4 5 (1.10%) QA
5 4 (0.88%) MISRA C
6 3 (0.66%) Accessibility
6 3 (0.66%) GDPR
7 2 (0.44%) DO-178B
7 2 (0.44%) DO-254
7 2 (0.44%) ISO/IEC 12207
8 1 (0.22%) AQAP
8 1 (0.22%) TickIT
System Software
1 42 (9.27%) Docker
2 3 (0.66%) Firmware
3 1 (0.22%) Virtual Machines
3 1 (0.22%) VMware Infrastructure
Systems Management
1 39 (8.61%) Kubernetes
2 10 (2.21%) Ansible
3 6 (1.32%) Progress Chef
4 4 (0.88%) Terraform
5 3 (0.66%) Grafana
5 3 (0.66%) Prometheus
6 2 (0.44%) Docker Swarm
6 2 (0.44%) Functional Safety
Vendors
1 27 (5.96%) ESRI
2 25 (5.52%) Oracle
3 22 (4.86%) Microsoft
4 10 (2.21%) Xamarin
5 9 (1.99%) Google
6 6 (1.32%) SAP
7 5 (1.10%) IBM
8 4 (0.88%) Teradata
9 3 (0.66%) Kofax
9 3 (0.66%) Pega
9 3 (0.66%) Red Hat
9 3 (0.66%) ServiceNow
10 1 (0.22%) Adobe
10 1 (0.22%) Databricks
10 1 (0.22%) Dataiku
10 1 (0.22%) Netlify
10 1 (0.22%) Samsung
10 1 (0.22%) Veracode
10 1 (0.22%) VMware