Software Engineering Jobs in the South West

Software Engineering
England > South West

The table below provides summary statistics for permanent job vacancies advertised in the South West requiring Software Engineering skills. It includes a benchmarking guide to the annual salaries offered in vacancies that cited Software Engineering over the 6 months leading up to 1 May 2025, comparing them to the same period in the previous two years.

6 months to
1 May 2025
Same period 2024 Same period 2023
Rank 9 11 18
Rank change year-on-year +2 +7 -5
Permanent jobs citing Software Engineering 490 1,238 778
As % of all permanent jobs advertised in the South West 14.06% 13.43% 11.27%
As % of the Processes & Methodologies category 15.19% 15.96% 11.93%
Number of salaries quoted 292 943 480
10th Percentile £35,000 £32,500 £37,500
25th Percentile £49,688 £45,000 £46,250
Median annual salary (50th Percentile) £55,000 £55,000 £60,000
Median % change year-on-year - -8.33% +4.35%
75th Percentile £71,250 £68,750 £77,715
90th Percentile £87,250 £80,000 £95,000
England median annual salary £67,500 £62,500 £72,500
% change year-on-year +8.00% -13.79% +3.57%

All Process and Methodology Skills
South West

Software Engineering falls under the Processes and Methodologies category. For comparison with the information above, the following table provides summary statistics for all permanent job vacancies requiring process or methodology skills in the South West.

Permanent vacancies with a requirement for process or methodology skills 3,226 7,759 6,520
As % of all permanent jobs advertised in the South West 92.57% 84.14% 94.44%
Number of salaries quoted 1,918 5,562 3,654
10th Percentile £27,500 £28,833 £30,500
25th Percentile £37,500 £37,500 £39,213
Median annual salary (50th Percentile) £52,600 £50,500 £52,500
Median % change year-on-year +4.16% -3.81% +5.00%
75th Percentile £64,100 £65,000 £68,750
90th Percentile £78,750 £80,000 £81,250
England median annual salary £57,500 £55,000 £62,500
% change year-on-year +4.55% -12.00% +4.17%

Software Engineering
Job Vacancy Trend in the South West

Job postings citing Software Engineering as a proportion of all IT jobs advertised in the South West.
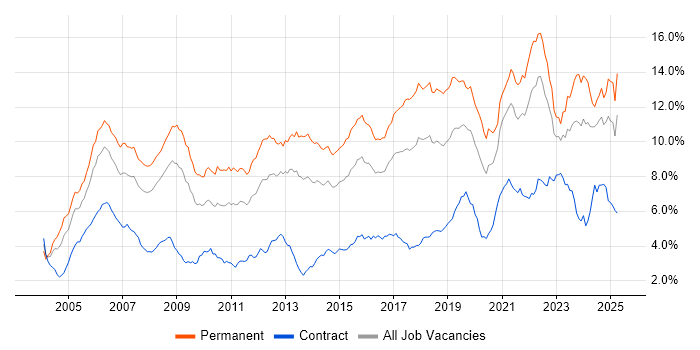
Job vacancy trend for Software Engineering in the South West

Software Engineering
Salary Trend in the South West

3-month moving average salary quoted in jobs citing Software Engineering in the South West.

Salary trend for Software Engineering in the South West

Software Engineering
Salary Histogram in the South West

Salary distribution for jobs citing Software Engineering in the South West over the 6 months to 1 May 2025.

Salary histogram for Software Engineering in the South West

Software Engineering
Job Locations in the South West

The table below looks at the demand and provides a guide to the median salaries quoted in IT jobs citing Software Engineering within the South West region over the 6 months to 1 May 2025. The 'Rank Change' column provides an indication of the change in demand within each location based on the same 6 month period last year.

Location Rank Change
on Same Period
Last Year
Matching
Permanent
IT Job Ads
Median Salary
Past 6 Months
Median Salary
% Change
on Same Period
Last Year
Live
Jobs
Bristol +3 270 £55,000 -4.35% 134
Gloucestershire +1 104 £52,600 +0.19% 111
Dorset -10 37 £52,500 -4.55% 26
Somerset -6 27 £77,500 +55.00% 37
Devon -14 26 £65,000 +52.94% 34
Wiltshire -9 22 £52,500 -4.55% 24
Cornwall +13 2 £77,500 -3.13% 5
Software Engineering
England

Software Engineering
Co-occurring Skills and Capabilities in the South West by Category

The follow tables expand on the table above by listing co-occurrences grouped by category. The same employment type, locality and period is covered with up to 20 co-occurrences shown in each of the following categories:

Application Platforms
1 20 (4.08%) Jupyter
2 7 (1.43%) Apache
3 5 (1.02%) Confluence
3 5 (1.02%) OpenStack
4 1 (0.20%) NServiceBus
Applications
1 75 (15.31%) Simulink
2 8 (1.63%) Microsoft Excel
Business Applications
1 4 (0.82%) ResourceLink
2 2 (0.41%) Oracle BPM
2 2 (0.41%) Oracle Subledger Accounting
3 1 (0.20%) BASE24
3 1 (0.20%) Oracle ERP
Cloud Services
1 102 (20.82%) AWS
2 80 (16.33%) Azure
3 42 (8.57%) GCP
4 25 (5.10%) GitHub
5 21 (4.29%) Serverless
6 17 (3.47%) SaaS
7 16 (3.27%) GitHub Actions
8 10 (2.04%) Azure DevOps
9 7 (1.43%) Azure Data Factory
10 6 (1.22%) Amazon EC2
10 6 (1.22%) Amazon S3
10 6 (1.22%) Azure Functions
10 6 (1.22%) Azure Service Bus
11 5 (1.02%) Azure Logic Apps
11 5 (1.02%) npm
11 5 (1.02%) Power Automate
12 4 (0.82%) AWS Lambda
12 4 (0.82%) Cloud Computing
12 4 (0.82%) Figma
12 4 (0.82%) Power Platform
Communications & Networking
1 12 (2.45%) 5G
1 12 (2.45%) SD-WAN
1 12 (2.45%) WAN
2 4 (0.82%) Wi-Fi
3 2 (0.41%) Ethernet
3 2 (0.41%) Reverse Proxy
4 1 (0.20%) ATM
4 1 (0.20%) GSM
4 1 (0.20%) Internet
Database & Business Intelligence
1 23 (4.69%) Big Data
2 20 (4.08%) MySQL
3 14 (2.86%) MongoDB
3 14 (2.86%) NoSQL
4 13 (2.65%) Relational Database
5 10 (2.04%) SQL Server
6 7 (1.43%) Elasticsearch
7 5 (1.02%) Amazon RDS
7 5 (1.02%) DynamoDB
7 5 (1.02%) PostgreSQL
8 4 (0.82%) BigQuery
9 3 (0.61%) Amazon Aurora
9 3 (0.61%) Tableau
10 2 (0.41%) Oracle Database
10 2 (0.41%) Power BI
10 2 (0.41%) RavenDB
11 1 (0.20%) Azure SQL Database
11 1 (0.20%) Data Warehouse
11 1 (0.20%) NonStop SQL
11 1 (0.20%) SQLite
Development Applications
1 56 (11.43%) Git
2 30 (6.12%) GitLab
3 17 (3.47%) Jenkins
4 14 (2.86%) JIRA
5 9 (1.84%) Visual Studio
6 8 (1.63%) Cucumber
7 7 (1.43%) Sonatype Nexus
8 6 (1.22%) Eclipse
8 6 (1.22%) Eclipse RCP
8 6 (1.22%) Visual Studio Code
9 5 (1.02%) Cypress.io
9 5 (1.02%) JUnit
9 5 (1.02%) Postman
9 5 (1.02%) webpack
10 4 (0.82%) LabVIEW
10 4 (0.82%) Maven
10 4 (0.82%) NetBeans
10 4 (0.82%) PROIV
10 4 (0.82%) Selenium
11 3 (0.61%) Xcode
General
1 106 (21.63%) Finance
2 91 (18.57%) Electronics
3 64 (13.06%) Social Skills
4 58 (11.84%) Banking
5 42 (8.57%) Analytical Skills
6 28 (5.71%) Inclusion and Diversity
7 18 (3.67%) Marketing
8 17 (3.47%) Retail
9 16 (3.27%) Games
10 13 (2.65%) Manufacturing
11 12 (2.45%) Aerospace
12 11 (2.24%) Presentation Skills
13 8 (1.63%) Legal
13 8 (1.63%) Local Government
13 8 (1.63%) Organisational Skills
13 8 (1.63%) Public Sector
14 5 (1.02%) Financial Institution
15 3 (0.61%) Law
15 3 (0.61%) Private Banking
15 3 (0.61%) Telecoms
Job Titles
1 205 (41.84%) Software Engineer
2 89 (18.16%) Senior
3 78 (15.92%) Systems Engineer
4 52 (10.61%) Lead
5 46 (9.39%) Senior Software Engineer
6 31 (6.33%) Developer
7 27 (5.51%) Principal Engineer
7 27 (5.51%) Software Assurance Engineer
8 23 (4.69%) Data Scientist
9 20 (4.08%) Senior Data Scientist
9 20 (4.08%) Technical Leader
10 17 (3.47%) Full-Stack Engineer
10 17 (3.47%) Full-Stack Software Engineer
11 16 (3.27%) Lead Software Engineer
12 14 (2.86%) Team Leader
13 12 (2.45%) Java Engineer
13 12 (2.45%) Java Software Engineer
14 10 (2.04%) Analyst
14 10 (2.04%) Junior
15 9 (1.84%) Embedded Software Engineer
Libraries, Frameworks & Software Standards
1 60 (12.24%) React
2 35 (7.14%) HTML
2 35 (7.14%) Node.js
3 32 (6.53%) .NET
3 32 (6.53%) CSS
4 30 (6.12%) Spring Boot
5 25 (5.10%) AngularJS
6 20 (4.08%) Spring
7 15 (3.06%) RESTful
8 13 (2.65%) LAMP
8 13 (2.65%) Laravel
8 13 (2.65%) XML
9 12 (2.45%) .NET Core
9 12 (2.45%) REST
9 12 (2.45%) Software Packaging
10 9 (1.84%) Kafka
11 8 (1.63%) .NET Framework
11 8 (1.63%) Jest
11 8 (1.63%) Web Services
12 7 (1.43%) Middleware
Miscellaneous
1 31 (6.33%) Algorithms
2 21 (4.29%) Cyberattack
3 18 (3.67%) Self-Motivation
4 17 (3.47%) Mobile App
5 14 (2.86%) Private Cloud
6 12 (2.45%) Product Ownership
6 12 (2.45%) Self-Driving Car
7 8 (1.63%) Data Structures
8 7 (1.43%) Public Cloud
8 7 (1.43%) Reinsurance
9 6 (1.22%) Client/Server
9 6 (1.22%) Cloud Native
9 6 (1.22%) Hackathon
10 5 (1.02%) Data Centre
10 5 (1.02%) Greenfield Project
10 5 (1.02%) Learning Management System
10 5 (1.02%) Reference Data
11 4 (0.82%) GNSS
11 4 (0.82%) Legacy Systems
11 4 (0.82%) Robotics
Operating Systems
1 40 (8.16%) Linux
2 22 (4.49%) Windows
3 8 (1.63%) Apple iOS
4 7 (1.43%) Android
5 2 (0.41%) Unix
6 1 (0.20%) Embedded Linux
6 1 (0.20%) Windows Server
Processes & Methodologies
1 157 (32.04%) Agile
2 144 (29.39%) Systems Engineering
3 134 (27.35%) Mathematics
4 106 (21.63%) Problem-Solving
5 95 (19.39%) Decision-Making
6 93 (18.98%) Validation
7 89 (18.16%) Mentoring
8 87 (17.76%) DevOps
9 83 (16.94%) CI/CD
10 74 (15.10%) Test Automation
11 72 (14.69%) Computer Science
11 72 (14.69%) Digital Twin
11 72 (14.69%) Model-Based Systems Engineering
11 72 (14.69%) Software Assurance
11 72 (14.69%) SysML
11 72 (14.69%) Verification and Validation
12 58 (11.84%) Artificial Intelligence
13 56 (11.43%) Microservices
14 49 (10.00%) Full-Stack Development
14 49 (10.00%) Scrum
Programming Languages
1 125 (25.51%) Java
2 113 (23.06%) Python
3 103 (21.02%) JavaScript
4 77 (15.71%) MATLAB
5 49 (10.00%) SQL
6 41 (8.37%) C#
7 32 (6.53%) C++
8 31 (6.33%) TypeScript
9 22 (4.49%) PHP
10 13 (2.65%) Rust
11 12 (2.45%) C
12 9 (1.84%) Bash
13 8 (1.63%) Go
14 7 (1.43%) Kotlin
15 4 (0.82%) Ada
15 4 (0.82%) Swift
16 3 (0.61%) Clojure
16 3 (0.61%) Embedded C
16 3 (0.61%) VB.NET
17 2 (0.41%) PL/SQL
Qualifications
1 177 (36.12%) Degree
2 78 (15.92%) BPSS Clearance
3 75 (15.31%) HNC
4 72 (14.69%) HND
4 72 (14.69%) Security Cleared
5 33 (6.73%) DV Cleared
6 31 (6.33%) Computer Science Degree
7 30 (6.12%) SC Cleared
8 10 (2.04%) Master's Degree
9 7 (1.43%) ISTQB
10 6 (1.22%) PhD
11 4 (0.82%) AWS Certification
11 4 (0.82%) Azure Certification
11 4 (0.82%) DBS Check
12 3 (0.61%) AWS Certified Solutions Architect
12 3 (0.61%) TOGAF Certification
13 2 (0.41%) Microsoft Certification
Quality Assurance & Compliance
1 22 (4.49%) QA
2 12 (2.45%) PMO
3 8 (1.63%) ISO/IEC 27001
4 6 (1.22%) Accessibility
4 6 (1.22%) NIST
5 5 (1.02%) Def Stans
6 4 (0.82%) IEC 61508
6 4 (0.82%) JSP 440
6 4 (0.82%) NIST 800
7 3 (0.61%) IEC 61131
7 3 (0.61%) WCAG
8 1 (0.20%) Data Quality
8 1 (0.20%) ISO 9001
8 1 (0.20%) MISRA
System Software
1 63 (12.86%) Docker
2 5 (1.02%) Firmware
3 1 (0.20%) Virtual Machines
Systems Management
1 58 (11.84%) Kubernetes
2 19 (3.88%) Terraform
3 6 (1.22%) BMC PATROL
3 6 (1.22%) Kibana
4 3 (0.61%) Ansible
5 2 (0.41%) Argo
5 2 (0.41%) Graylog
5 2 (0.41%) Istio
5 2 (0.41%) Podman
5 2 (0.41%) Single Sign-On
Vendors
1 26 (5.31%) Microsoft
2 17 (3.47%) Google
3 14 (2.86%) Oracle
4 9 (1.84%) Databricks
5 8 (1.63%) Atlassian
6 6 (1.22%) Graphcore
6 6 (1.22%) IBM
7 4 (0.82%) F5
7 4 (0.82%) Intel
8 3 (0.61%) SAP
9 2 (0.41%) Dynatrace
9 2 (0.41%) SnapLogic
9 2 (0.41%) Splunk
9 2 (0.41%) Twitter
9 2 (0.41%) UiPath
10 1 (0.20%) HP
10 1 (0.20%) MuleSoft
10 1 (0.20%) QNX
10 1 (0.20%) Salesforce