Lead .NET Developer Job Trends in the City of London

Lead .NET Developer
Central London > City of London

The median Lead .NET Developer salary in the City of London is £92,500 per year, according to job vacancies posted during the 6 months leading to 16 October 2025.

The table below compares current salary benchmarking and summary statistics with the previous two years.

6 months to
16 Oct 2025
Same period 2024 Same period 2023
Rank 124 173 175
Rank change year-on-year +49 +2 +108
Permanent jobs requiring a Lead .NET Developer 3 1 7
As % of all permanent jobs in the City of London 0.19% 0.036% 0.22%
As % of the Job Titles category 0.20% 0.038% 0.23%
Number of salaries quoted 2 1 6
10th Percentile £77,250 - £87,750
25th Percentile £80,625 £58,750 £100,625
Median annual salary (50th Percentile) £92,500 £62,500 £110,000
Median % change year-on-year +48.00% -43.18% +15.79%
75th Percentile £105,625 £66,250 -
90th Percentile £109,750 - £111,250
Central London median annual salary £92,500 £62,500 £107,500
% change year-on-year +48.00% -41.86% +13.16%

All Permanent IT Job Vacancies
City of London

For comparison with the information above, the following table provides summary statistics for all permanent IT job vacancies in the City of London. Most job vacancies include a discernible job title that can be normalized. As such, the figures in the second row provide an indication of the number of permanent jobs in our overall sample.

Permanent vacancies in the City of London with a recognized job title 1,519 2,631 3,053
% of permanent jobs with a recognized job title 94.41% 93.86% 96.31%
Number of salaries quoted 1,242 1,749 2,736
10th Percentile £36,750 £45,000 £40,000
25th Percentile £52,500 £55,000 £53,750
Median annual salary (50th Percentile) £72,500 £75,000 £72,500
Median % change year-on-year -3.33% +3.45% -3.33%
75th Percentile £95,000 £95,000 £95,000
90th Percentile £122,500 £115,000 £115,000
Central London median annual salary £75,000 £72,500 £72,500
% change year-on-year +3.45% - -

Lead .NET Developer
Job Vacancy Trend in the City of London

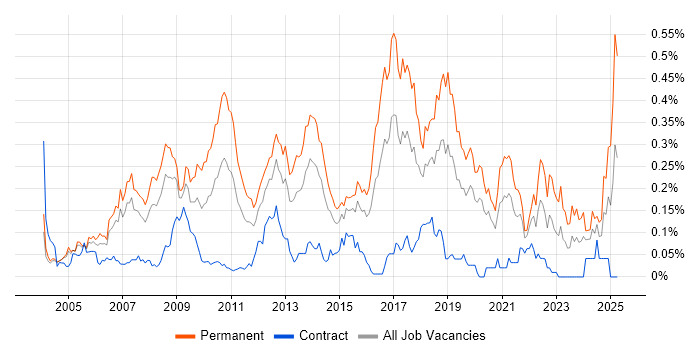
Historical trend showing the proportion of permanent IT job postings featuring 'Lead .NET Developer' in the job title relative to all permanent IT jobs advertised in the City of London.

Lead .NET Developer job vacancy trend in the City of London

Lead .NET Developer
Salary Trend in the City of London

Salary distribution trend for Lead .NET Developer job vacancies in the City of London.

Salary distribution trend for Lead .NET Developer job vacancies in the City of London

Lead .NET Developer
Salary Histogram in the City of London

Salary distribution for jobs citing Lead .NET Developer in the City of London over the 6 months to 16 October 2025.

Salary histogram for Lead .NET Developer in the City of London

Lead .NET Developer Skill Set
Top 30 Co-Occurring Skills & Capabilities in the City of London

For the 6 months to 16 October 2025, Lead .NET Developer job roles required the following skills and capabilities in order of popularity. The figures indicate the absolute number of co-occurrences and as a proportion of all permanent job ads across the City of London region featuring Lead .NET Developer in the job title.

1 3 (100.00%) .NET
1 3 (100.00%) Azure
2 2 (66.67%) C#
2 2 (66.67%) JavaScript
2 2 (66.67%) Mentoring
2 2 (66.67%) Microsoft
3 1 (33.33%) Agile
3 1 (33.33%) AI
3 1 (33.33%) AngularJS
3 1 (33.33%) API Development
3 1 (33.33%) Azure DevOps
3 1 (33.33%) Azure Logic Apps
3 1 (33.33%) Azure Service Bus
3 1 (33.33%) Business Intelligence
3 1 (33.33%) CI/CD
3 1 (33.33%) Coaching
3 1 (33.33%) CSS
3 1 (33.33%) Design Patterns
3 1 (33.33%) DevOps
3 1 (33.33%) Event-Driven
3 1 (33.33%) Event-Driven Architecture
3 1 (33.33%) Front End Development
3 1 (33.33%) Full-Stack Development
3 1 (33.33%) Generative AI
3 1 (33.33%) HTML
3 1 (33.33%) Infrastructure as Code
3 1 (33.33%) Kafka
3 1 (33.33%) Kanban
3 1 (33.33%) Kubernetes
3 1 (33.33%) Microservices

Lead .NET Developer Skill Set
Co-Occurring Skills & Capabilities in the City of London by Category

The following tables expand on the one above by listing co-occurrences grouped by category. They cover the same employment type, locality and period, with up to 20 co-occurrences shown in each category:

Cloud Services
1 3 (100.00%) Azure
2 1 (33.33%) Azure DevOps
2 1 (33.33%) Azure Logic Apps
2 1 (33.33%) Azure Service Bus
2 1 (33.33%) Power Automate
2 1 (33.33%) Power Platform
2 1 (33.33%) PowerApps
Database & Business Intelligence
1 1 (33.33%) MongoDB
1 1 (33.33%) NoSQL
1 1 (33.33%) PostgreSQL
1 1 (33.33%) Power BI
1 1 (33.33%) SQL Server
Development Applications
1 1 (33.33%) MSTest
1 1 (33.33%) NUnit
General
1 2 (66.67%) Legal
2 1 (33.33%) Finance
2 1 (33.33%) Social Skills
Libraries, Frameworks & Software Standards
1 3 (100.00%) .NET
2 1 (33.33%) AngularJS
2 1 (33.33%) CSS
2 1 (33.33%) HTML
2 1 (33.33%) Kafka
2 1 (33.33%) RabbitMQ
2 1 (33.33%) React
Miscellaneous
1 1 (33.33%) Product Ownership
Processes & Methodologies
1 2 (66.67%) Mentoring
2 1 (33.33%) Agile
2 1 (33.33%) AI
2 1 (33.33%) API Development
2 1 (33.33%) CI/CD
2 1 (33.33%) Coaching
2 1 (33.33%) Design Patterns
2 1 (33.33%) DevOps
2 1 (33.33%) Event-Driven
2 1 (33.33%) Event-Driven Architecture
2 1 (33.33%) Front End Development
2 1 (33.33%) Full-Stack Development
2 1 (33.33%) Generative AI
2 1 (33.33%) Infrastructure as Code
2 1 (33.33%) Kanban
2 1 (33.33%) Microservices
2 1 (33.33%) Scrum
2 1 (33.33%) Strategic Thinking
2 1 (33.33%) TDD
2 1 (33.33%) Unit Testing
Programming Languages
1 2 (66.67%) C#
1 2 (66.67%) JavaScript
2 1 (33.33%) PowerShell
2 1 (33.33%) SQL
2 1 (33.33%) TypeScript
Systems Management
1 1 (33.33%) Kubernetes
Vendors
1 2 (66.67%) Microsoft