Computer Science Jobs in Glasgow

Computer Science
Scotland > Glasgow

The table below provides summary statistics for permanent job vacancies advertised in Glasgow requiring Computer Science skills. It includes a benchmarking guide to the annual salaries offered in vacancies that cited Computer Science over the 6 months leading up to 14 November 2024, comparing them to the same period in the previous two years.

6 months to
14 Nov 2024
Same period 2023 Same period 2022
Rank 40 55 26
Rank change year-on-year +15 -29 +31
Permanent jobs citing Computer Science 42 38 103
As % of all permanent jobs advertised in Glasgow 4.21% 4.26% 7.40%
As % of the Processes & Methodologies category 4.90% 4.36% 7.83%
Number of salaries quoted 15 17 30
10th Percentile £37,100 £37,250 £44,725
25th Percentile £41,875 £45,000 £50,500
Median annual salary (50th Percentile) £70,000 £55,000 £61,250
Median % change year-on-year +27.27% -10.20% +28.95%
75th Percentile £90,625 £57,500 £74,000
90th Percentile £91,250 £60,000 £87,500
Scotland median annual salary £48,000 £55,000 £55,000
% change year-on-year -12.73% - +16.43%

All Process and Methodology Skills
Glasgow

Computer Science falls under the Processes and Methodologies category. For comparison with the information above, the following table provides summary statistics for all permanent job vacancies requiring process or methodology skills in Glasgow.

Permanent vacancies with a requirement for process or methodology skills 858 871 1,315
As % of all permanent jobs advertised in Glasgow 85.97% 97.65% 94.54%
Number of salaries quoted 446 483 754
10th Percentile £29,875 £28,600 £31,250
25th Percentile £38,750 £37,500 £40,000
Median annual salary (50th Percentile) £55,000 £52,500 £52,500
Median % change year-on-year +4.76% - +5.00%
75th Percentile £70,000 £65,000 £66,781
90th Percentile £90,000 £75,000 £80,000
Scotland median annual salary £55,000 £52,500 £55,000
% change year-on-year +4.76% -4.55% +10.00%

Computer Science
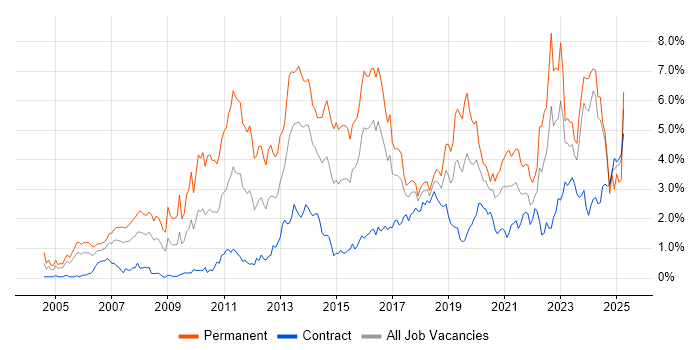
Job Vacancy Trend in Glasgow

Job postings citing Computer Science as a proportion of all IT jobs advertised in Glasgow.

Job vacancy trend for Computer Science in Glasgow

Computer Science
Salary Trend in Glasgow

3-month moving average salary quoted in jobs citing Computer Science in Glasgow.

Salary trend for Computer Science in Glasgow

Computer Science
Salary Histogram in Glasgow

Salary distribution for jobs citing Computer Science in Glasgow over the 6 months to 14 November 2024.

Salary histogram for Computer Science in Glasgow

Computer Science
Co-occurring Skills and Capabilities in Glasgow by Category

The follow tables expand on the table above by listing co-occurrences grouped by category. The same employment type, locality and period is covered with up to 20 co-occurrences shown in each of the following categories:

Applications
1 6 (14.29%) Simulink
2 1 (2.38%) Camtasia
2 1 (2.38%) Microsoft Excel
Business Applications
1 1 (2.38%) Oracle Applications
Cloud Services
1 18 (42.86%) Azure
2 8 (19.05%) AWS
3 7 (16.67%) GCP
4 5 (11.90%) Azure Cognitive Services
5 4 (9.52%) Cloud Computing
5 4 (9.52%) Power Platform
6 3 (7.14%) AWS Elastic Beanstalk
7 1 (2.38%) Amazon EC2
7 1 (2.38%) Amazon S3
7 1 (2.38%) AWS Lambda
7 1 (2.38%) Azure DevOps
7 1 (2.38%) Dynamics 365
7 1 (2.38%) Power Automate
7 1 (2.38%) PowerApps
7 1 (2.38%) SaaS
7 1 (2.38%) Serverless
Database & Business Intelligence
1 5 (11.90%) SQL Server
2 4 (9.52%) Power BI
3 3 (7.14%) Data Warehouse
3 3 (7.14%) Tableau
4 2 (4.76%) Spotfire
5 1 (2.38%) Amazon RDS
5 1 (2.38%) Data Mining
5 1 (2.38%) NoSQL
5 1 (2.38%) Oracle Database
5 1 (2.38%) Tableau Server
Development Applications
1 6 (14.29%) Git
2 1 (2.38%) Appium
2 1 (2.38%) JIRA
2 1 (2.38%) LabVIEW
2 1 (2.38%) Oracle APEX
2 1 (2.38%) Rational DOORS
2 1 (2.38%) Selenium
General
1 30 (71.43%) Social Skills
2 11 (26.19%) Analytical Skills
3 6 (14.29%) Automotive
3 6 (14.29%) Legal
4 3 (7.14%) Manufacturing
5 2 (4.76%) Banking
5 2 (4.76%) Front Office
5 2 (4.76%) Inclusion and Diversity
5 2 (4.76%) Investment Banking
5 2 (4.76%) Pharmaceutical
6 1 (2.38%) Electronics
6 1 (2.38%) Local Government
6 1 (2.38%) Presentation Skills
6 1 (2.38%) Public Sector
Job Titles
1 11 (26.19%) Architect
1 11 (26.19%) Developer
2 6 (14.29%) Software Architect
3 5 (11.90%) Cloud Architect
3 5 (11.90%) Web Developer
4 4 (9.52%) Head of Infrastructure
4 4 (9.52%) Lead
5 3 (7.14%) Incident Manager
5 3 (7.14%) Technical Leader
6 2 (4.76%) Data Scientist
6 2 (4.76%) Front Office Developer
6 2 (4.76%) Java Developer
6 2 (4.76%) Software Engineer
7 1 (2.38%) Analyst
7 1 (2.38%) Applications Developer
7 1 (2.38%) Data Analyst
7 1 (2.38%) Graduate
7 1 (2.38%) IT Manager
7 1 (2.38%) Lead Developer
7 1 (2.38%) Oracle Developer
Libraries, Frameworks & Software Standards
1 9 (21.43%) .NET
1 9 (21.43%) .NET Core
2 5 (11.90%) .NET Framework
2 5 (11.90%) ASP.NET
2 5 (11.90%) ASP.NET MVC
2 5 (11.90%) ASP.NET Web API
2 5 (11.90%) Entity Framework
2 5 (11.90%) Razor View Engine
3 2 (4.76%) XML
4 1 (2.38%) PyTorch
4 1 (2.38%) RESTful
4 1 (2.38%) TensorFlow
4 1 (2.38%) Web Services
Miscellaneous
1 9 (21.43%) Data Centre
2 7 (16.67%) Management Information System
3 6 (14.29%) Embedded Systems
4 3 (7.14%) Product Ownership
5 2 (4.76%) Life Science
6 1 (2.38%) Algorithms
6 1 (2.38%) CMDB
6 1 (2.38%) FPGA
6 1 (2.38%) Mobile App
6 1 (2.38%) Verilog
6 1 (2.38%) VHDL
6 1 (2.38%) Virtual Team
Operating Systems
1 4 (9.52%) Linux
1 4 (9.52%) Red Hat Enterprise Linux
1 4 (9.52%) Ubuntu
1 4 (9.52%) Windows
Processes & Methodologies
1 17 (40.48%) Problem-Solving
2 13 (30.95%) DevOps
3 11 (26.19%) Agile
4 9 (21.43%) Infrastructure as Code
4 9 (21.43%) Project Management
4 9 (21.43%) Technical Leadership
5 8 (19.05%) Artificial Intelligence
5 8 (19.05%) Requirements Gathering
6 6 (14.29%) Stakeholder Management
6 6 (14.29%) UML
7 5 (11.90%) Collaborative Culture
7 5 (11.90%) Enterprise Architecture
7 5 (11.90%) Full-Stack Development
7 5 (11.90%) MVC
7 5 (11.90%) Release Management
7 5 (11.90%) Strategic Thinking
7 5 (11.90%) TDD
7 5 (11.90%) Web Development
8 4 (9.52%) Fintech
8 4 (9.52%) Site Reliability Engineering
Programming Languages
1 11 (26.19%) Python
2 7 (16.67%) C++
3 6 (14.29%) C
3 6 (14.29%) C#
3 6 (14.29%) Embedded C
3 6 (14.29%) MATLAB
3 6 (14.29%) SQL
4 5 (11.90%) VB
5 3 (7.14%) Java
6 1 (2.38%) JavaScript
6 1 (2.38%) PL/SQL
Qualifications
1 38 (90.48%) Degree
2 22 (52.38%) Computer Science Degree
3 10 (23.81%) Master's Degree
4 9 (21.43%) Security Cleared
5 8 (19.05%) SC Cleared
6 5 (11.90%) Azure Certification
6 5 (11.90%) Microsoft Certification
7 3 (7.14%) CCNA
7 3 (7.14%) Cisco Certification
8 1 (2.38%) HND
8 1 (2.38%) OCP
8 1 (2.38%) Oracle Certification
Quality Assurance & Compliance
1 2 (4.76%) Accessibility
2 1 (2.38%) Data Quality
2 1 (2.38%) QA
System Software
1 1 (2.38%) Docker
1 1 (2.38%) Firmware
Systems Management
1 5 (11.90%) Kubernetes
2 4 (9.52%) Ansible
2 4 (9.52%) Terraform
Vendors
1 11 (26.19%) Microsoft
2 7 (16.67%) Google
3 5 (11.90%) VMware
4 3 (7.14%) Cisco
4 3 (7.14%) Juniper
4 3 (7.14%) Palo Alto
5 1 (2.38%) Adobe
5 1 (2.38%) ANSYS
5 1 (2.38%) Minitab
5 1 (2.38%) Oracle
5 1 (2.38%) ServiceNow
5 1 (2.38%) Xamarin