AI Job Trends in Glasgow

AI
Scotland > Glasgow

The table below provides summary statistics and salary benchmarking for jobs advertised in Glasgow requiring AI skills. It covers permanent job vacancies from the 6 months leading up to 10 October 2026, with comparisons to the same periods in the previous two years.

6 months to
10 Oct 2026
Same period 2025 Same period 2024
Rank 14 5 21
Rank change year-on-year -9 +16 +35
Permanent jobs citing AI 92 212 95
As % of all permanent jobs in Glasgow 6.19% 26.90% 8.45%
As % of the Processes & Methodologies category 8.11% 29.69% 9.72%
Number of salaries quoted 45 21 23
10th Percentile £26,250 £25,203 £39,400
25th Percentile £33,750 £45,000 £56,500
Median annual salary (50th Percentile) £72,500 £69,248 £65,000
Median % change year-on-year +4.70% +6.54% +18.18%
75th Percentile £85,000 £82,500 £70,000
90th Percentile £100,000 £85,000 £89,350
Scotland median annual salary £85,000 £66,250 £65,000
% change year-on-year +28.30% +1.92% -17.27%

All Process & Methodology Skills
Glasgow

AI falls under the Processes and Methodologies category. For comparison with the information above, the following table provides summary statistics for all permanent job vacancies requiring process or methodology skills in Glasgow.

Permanent vacancies with a requirement for process or methodology skills 1,134 714 977
As % of all permanent jobs advertised in Glasgow 76.31% 90.61% 86.92%
Number of salaries quoted 680 295 496
10th Percentile £30,000 £29,100 £30,000
25th Percentile £38,926 £32,851 £39,250
Median annual salary (50th Percentile) £55,000 £50,000 £54,195
Median % change year-on-year +10.00% -7.74% -1.46%
75th Percentile £75,000 £70,000 £70,000
90th Percentile £100,000 £85,000 £88,750
Scotland median annual salary £55,000 £38,000 £55,000
% change year-on-year +44.74% -30.91% +4.76%

AI
Job Vacancy Trend in Glasgow

Historical trend showing the proportion of permanent IT job postings citing AI relative to all permanent IT jobs advertised in Glasgow.

AI job vacancy trend in Glasgow

AI
Salary Trend in Glasgow

Salary distribution trend for jobs in Glasgow citing AI.
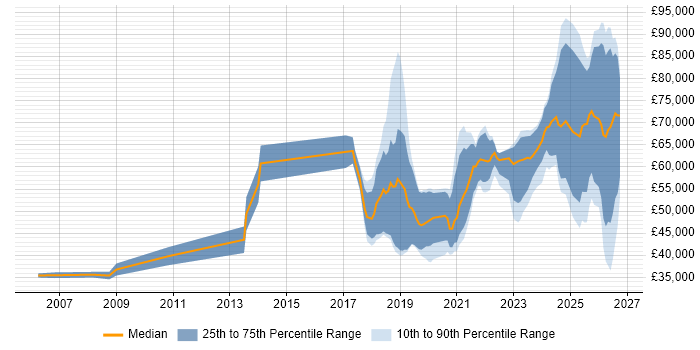
Salary distribution trend for jobs in Glasgow citing AI

AI
Salary Histogram in Glasgow

Salary distribution for jobs citing AI in Glasgow over the 6 months to 10 October 2026.

Salary histogram for AI in Glasgow

AI
Co-Occurring Skills & Capabilities in Glasgow by Category

The following tables expand on the one above by listing co-occurrences grouped by category. They cover the same employment type, locality and period, with up to 20 co-occurrences shown in each category:

Application Platforms
1 1 (1.09%) Apache
1 1 (1.09%) Apache Airflow
1 1 (1.09%) Apache Spark
1 1 (1.09%) Cloud Foundry
Applications
1 3 (3.26%) Microsoft Excel
Cloud Services
1 24 (26.09%) Azure
2 15 (16.30%) AWS
3 12 (13.04%) Azure AI
4 6 (6.52%) Azure DevOps
4 6 (6.52%) Power Platform
5 5 (5.43%) Amazon Bedrock
5 5 (5.43%) GCP
6 3 (3.26%) Amazon EKS
6 3 (3.26%) Amazon SageMaker
6 3 (3.26%) Copilot Studio
6 3 (3.26%) GitHub
6 3 (3.26%) Microsoft 365
6 3 (3.26%) Microsoft Copilot
6 3 (3.26%) Microsoft Purview
6 3 (3.26%) SaaS
7 2 (2.17%) Snowflake
8 1 (1.09%) Azure AKS
8 1 (1.09%) Azure Sentinel
8 1 (1.09%) Dynamics 365
8 1 (1.09%) GitHub Copilot
Communications & Networking
1 1 (1.09%) BGP
1 1 (1.09%) DNS
1 1 (1.09%) Firewall
1 1 (1.09%) Internet
1 1 (1.09%) IPFIX
1 1 (1.09%) Network Security
1 1 (1.09%) OSPF
1 1 (1.09%) SNMP
1 1 (1.09%) TCP/IP
1 1 (1.09%) VLAN
Database & Business Intelligence
1 9 (9.78%) MongoDB
2 8 (8.70%) Tableau
3 6 (6.52%) Azure SQL Database
4 4 (4.35%) Data Lake
5 3 (3.26%) Power BI
6 2 (2.17%) Amazon RDS
6 2 (2.17%) Chroma
6 2 (2.17%) DynamoDB
6 2 (2.17%) NoSQL
6 2 (2.17%) Pinecone
6 2 (2.17%) PostgreSQL
6 2 (2.17%) Redis
6 2 (2.17%) SQL Server
7 1 (1.09%) Amazon Aurora
7 1 (1.09%) Apache Iceberg
7 1 (1.09%) Big Data
7 1 (1.09%) Data Warehouse
7 1 (1.09%) InfluxDB
7 1 (1.09%) Metadata
7 1 (1.09%) Relational Database
Development Applications
1 4 (4.35%) Claude Code
2 3 (3.26%) Git
3 2 (2.17%) GitLab
3 2 (2.17%) Jenkins
4 1 (1.09%) Browser DevTools
General
1 35 (38.04%) Social Skills
2 31 (33.70%) Inclusion and Diversity
3 27 (29.35%) Finance
4 25 (27.17%) Marketing
5 23 (25.00%) Law
6 12 (13.04%) Analytical Skills
7 7 (7.61%) Banking
8 6 (6.52%) Financial Institution
9 4 (4.35%) Private Banking
9 4 (4.35%) Public Sector
10 3 (3.26%) Organisational Skills
11 2 (2.17%) Front Office
12 1 (1.09%) Advertising
12 1 (1.09%) Games
12 1 (1.09%) Influencing Skills
12 1 (1.09%) Legal
12 1 (1.09%) Local Government
12 1 (1.09%) Police
12 1 (1.09%) Telecoms
Job Titles
1 36 (39.13%) Lead
2 25 (27.17%) Software Engineer
3 21 (22.83%) Lead Software Engineer
4 17 (18.48%) Senior
5 16 (17.39%) Reliability Engineer
6 15 (16.30%) Developer
7 11 (11.96%) Sales Executive
8 9 (9.78%) Corporate Sales Executive
9 8 (8.70%) Senior Developer
10 7 (7.61%) .NET Developer
10 7 (7.61%) Artificial Intelligence Engineer
10 7 (7.61%) Senior Reliability Engineer
10 7 (7.61%) Senior Software Engineer
11 5 (5.43%) Analyst
11 5 (5.43%) Architect
11 5 (5.43%) Engineering Manager
11 5 (5.43%) Risk Manager
11 5 (5.43%) Technical Leader
11 5 (5.43%) Technical Manager
12 3 (3.26%) Junior
Libraries, Frameworks & Software Standards
1 11 (11.96%) React
2 7 (7.61%) .NET
3 6 (6.52%) .NET Core
3 6 (6.52%) ASP.NET
3 6 (6.52%) ASP.NET Core
3 6 (6.52%) Blazor
3 6 (6.52%) ML.NET
3 6 (6.52%) RESTful
3 6 (6.52%) Terraform
4 5 (5.43%) CrewAI
4 5 (5.43%) LangChain
4 5 (5.43%) LangGraph
5 4 (4.35%) Hugging Face
5 4 (4.35%) OpenTelemetry
5 4 (4.35%) PyTorch
6 3 (3.26%) Ray
6 3 (3.26%) vLLM
7 2 (2.17%) FastAPI
7 2 (2.17%) pgvector
7 2 (2.17%) REST
Miscellaneous
1 13 (14.13%) AI Agents
2 7 (7.61%) Algorithms
2 7 (7.61%) Social Media
3 6 (6.52%) BBC
3 6 (6.52%) Cloud Native
4 4 (4.35%) Distributed Systems
4 4 (4.35%) Product Ownership
4 4 (4.35%) Virtual Team
5 2 (2.17%) Credit Risk
5 2 (2.17%) Embedded Systems
5 2 (2.17%) FPGA
5 2 (2.17%) Onboarding
5 2 (2.17%) PCIe
5 2 (2.17%) Reference Data
5 2 (2.17%) Verilog
5 2 (2.17%) VHDL
6 1 (1.09%) Autonomous Agent
6 1 (1.09%) Hybrid Cloud
6 1 (1.09%) Mobile App
6 1 (1.09%) Private Cloud
Operating Systems
1 1 (1.09%) Windows
Processes & Methodologies
1 32 (34.78%) Software Engineering
2 26 (28.26%) Machine Learning
3 24 (26.09%) LLM
4 22 (23.91%) Agile
5 20 (21.74%) Generative AI
6 19 (20.65%) Problem-Solving
7 18 (19.57%) Decision-Making
7 18 (19.57%) Infrastructure Engineering
8 16 (17.39%) Continuous Improvement
9 14 (15.22%) Analytics
10 13 (14.13%) Observability
11 12 (13.04%) CI/CD
11 12 (13.04%) Validation
12 11 (11.96%) Stakeholder Management
12 11 (11.96%) Technology Strategy
13 10 (10.87%) Customer Experience
13 10 (10.87%) DevOps
13 10 (10.87%) Email Marketing
13 10 (10.87%) IT Strategy
13 10 (10.87%) Workflow
Programming Languages
1 23 (25.00%) Python
2 9 (9.78%) SQL
3 8 (8.70%) JavaScript
4 7 (7.61%) C#
5 4 (4.35%) Java
6 3 (3.26%) Go
6 3 (3.26%) TypeScript
7 2 (2.17%) C
7 2 (2.17%) SystemVerilog
8 1 (1.09%) Bash
Qualifications
1 10 (10.87%) Degree
2 6 (6.52%) Azure Certification
3 4 (4.35%) PhD
4 2 (2.17%) Computer Science Degree
4 2 (2.17%) Security Cleared
5 1 (1.09%) DV Cleared
5 1 (1.09%) Master's Degree
Quality Assurance & Compliance
1 2 (2.17%) Cyber Essentials
1 2 (2.17%) GRC
1 2 (2.17%) ISO/IEC 27001
1 2 (2.17%) NIST
2 1 (1.09%) Accessibility
2 1 (1.09%) QA
2 1 (1.09%) SLA
2 1 (1.09%) WCAG
System Software
1 2 (2.17%) Docker
1 2 (2.17%) Firmware
Systems Management
1 13 (14.13%) Kubernetes
2 5 (5.43%) Grafana
3 4 (4.35%) Prometheus
4 1 (1.09%) Microsoft Intune
4 1 (1.09%) Nagios
4 1 (1.09%) ZABBIX
Vendors
1 23 (25.00%) Microsoft
2 9 (9.78%) Cisco
2 9 (9.78%) Google
3 8 (8.70%) Dell
4 6 (6.52%) Apple
4 6 (6.52%) Facebook
4 6 (6.52%) OpenAI
4 6 (6.52%) Sony
4 6 (6.52%) Yahoo!
5 5 (5.43%) Alteryx
6 3 (3.26%) Databricks
6 3 (3.26%) NVIDIA
7 2 (2.17%) Mistral
8 1 (1.09%) Dynatrace
8 1 (1.09%) HubSpot
8 1 (1.09%) Meraki
8 1 (1.09%) Oracle
8 1 (1.09%) SolarWinds
8 1 (1.09%) Splunk
8 1 (1.09%) YouTube