Computer Science Jobs in Scotland

Computer Science
UK > Scotland

The following table provides summary statistics for permanent job vacancies advertised in Scotland with a requirement for Computer Science skills. Included is a benchmarking guide to the salaries offered in vacancies that have cited Computer Science over the 6 months to 1 December 2023 with a comparison to the same period in the previous 2 years.

6 months to
1 Dec 2023
Same period 2022 Same period 2021
Rank 58 41 71
Rank change year-on-year -17 +30 -4
Permanent jobs citing Computer Science 157 334 171
As % of all permanent jobs advertised in Scotland 5.50% 6.62% 3.69%
As % of the Processes & Methodologies category 5.71% 7.05% 3.96%
Number of salaries quoted 111 81 93
10th Percentile £27,500 £36,768 £26,250
25th Percentile £46,250 £43,500 £39,000
Median annual salary (50th Percentile) £55,000 £55,000 £47,500
Median % change year-on-year - +15.79% -12.10%
75th Percentile £67,500 £68,750 £55,000
90th Percentile £75,000 £79,250 £67,500
UK median annual salary £65,000 £60,000 £60,000
% change year-on-year +8.33% - +4.35%

All Process and Methodology Skills
Scotland

Computer Science is in the Processes and Methodologies category. The following table is for comparison with the above and provides summary statistics for all permanent job vacancies advertised in Scotland with a requirement for process or methodology skills.

Permanent vacancies with a requirement for process or methodology skills 2,750 4,739 4,313
As % of all permanent jobs advertised in Scotland 96.32% 93.88% 93.13%
Number of salaries quoted 1,755 2,596 2,715
10th Percentile £25,000 £33,000 £30,000
25th Percentile £35,000 £41,250 £38,750
Median annual salary (50th Percentile) £52,500 £55,000 £50,000
Median % change year-on-year -4.55% +10.00% +5.26%
75th Percentile £69,900 £72,500 £66,250
90th Percentile £82,919 £85,000 £80,000
UK median annual salary £60,000 £60,000 £60,000
% change year-on-year - - +9.09%

Computer Science
Job Vacancy Trend in Scotland

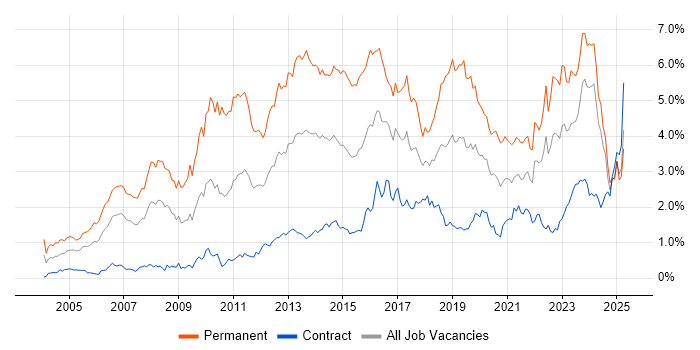
Job postings citing Computer Science as a proportion of all IT jobs advertised in Scotland.

Job vacancy trend for Computer Science in Scotland

Computer Science
Salary Trend in Scotland

3-month moving average salary quoted in jobs citing Computer Science in Scotland.

Salary trend for Computer Science in Scotland

Computer Science
Salary Histogram in Scotland

Salary distribution for jobs citing Computer Science in Scotland over the 6 months to 1 December 2023.

Salary histogram for Computer Science in Scotland

Computer Science
Job Locations in Scotland

The table below looks at the demand and provides a guide to the median salaries quoted in IT jobs citing Computer Science within the Scotland region over the 6 months to 1 December 2023. The 'Rank Change' column provides an indication of the change in demand within each location based on the same 6 month period last year.

Location Rank Change
on Same Period
Last Year
Matching
Permanent
IT Job Ads
Median Salary
Past 6 Months
Median Salary
% Change
on Same Period
Last Year
Live
Jobs
Edinburgh +15 69 £65,000 +23.81% 37
Glasgow -33 38 £55,000 -12.00% 23
Aberdeen +24 18 £65,000 - 13
Aberdeenshire +5 4 £27,000 - 4
Dundee -5 4 £50,000 - 5
Lanarkshire +27 1 - - 8
Fife -7 1 £55,000 - 4
Renfrewshire - 1 £47,500 - 3
North Lanarkshire - 1 £26,000 -
Computer Science
UK

Computer Science
Co-occurring Skills and Capabilities in Scotland by Category

The follow tables expand on the table above by listing co-occurrences grouped by category. The same employment type, locality and period is covered with up to 20 co-occurrences shown in each of the following categories:

Application Platforms
1 10 (6.37%) Confluence
2 5 (3.18%) SharePoint
3 4 (2.55%) SharePoint Server
4 2 (1.27%) Jetty
4 2 (1.27%) Tomcat
5 1 (0.64%) Apache Spark
5 1 (0.64%) MS Exchange
Applications
1 1 (0.64%) Microsoft Excel
1 1 (0.64%) Microsoft Office
Cloud Services
1 45 (28.66%) AWS
2 27 (17.20%) Azure
3 21 (13.38%) GitHub
3 21 (13.38%) SaaS
4 19 (12.10%) Amazon EC2
4 19 (12.10%) GCP
5 5 (3.18%) Microsoft 365
6 4 (2.55%) Cloud Computing
7 2 (1.27%) Azure DevOps
7 2 (1.27%) BlazeMeter
8 1 (0.64%) Azure Sentinel
8 1 (0.64%) Power Platform
8 1 (0.64%) WhatsApp
Communications & Networking
1 17 (10.83%) Wireless
2 7 (4.46%) Network Security
3 5 (3.18%) DHCP
3 5 (3.18%) DNS
3 5 (3.18%) Firewall
4 4 (2.55%) Broadband
4 4 (2.55%) HTTP
4 4 (2.55%) SNMP
5 3 (1.91%) Internet
5 3 (1.91%) Junos
5 3 (1.91%) MPLS
5 3 (1.91%) OSPF
5 3 (1.91%) RSVP
6 2 (1.27%) MQTT
7 1 (0.64%) Intrusion Detection
7 1 (0.64%) TCP/IP
7 1 (0.64%) VLAN
7 1 (0.64%) VPN
Database & Business Intelligence
1 23 (14.65%) MySQL
2 19 (12.10%) Amazon RDS
3 6 (3.82%) Relational Database
4 5 (3.18%) Big Data
4 5 (3.18%) NoSQL
5 4 (2.55%) Data Warehouse
5 4 (2.55%) SQL Server
6 3 (1.91%) Geospatial Data
6 3 (1.91%) PostgreSQL
7 2 (1.27%) Data Lake
7 2 (1.27%) MongoDB
7 2 (1.27%) Redis
8 1 (0.64%) Apache Hive
8 1 (0.64%) Power BI
8 1 (0.64%) RDBMS
8 1 (0.64%) Snowflake Schema
8 1 (0.64%) Tableau
Development Applications
1 29 (18.47%) Git
2 23 (14.65%) Jenkins
3 21 (13.38%) Maven
4 19 (12.10%) IntelliJ
5 12 (7.64%) JIRA
6 2 (1.27%) Gradle
6 2 (1.27%) Jasmine
6 2 (1.27%) JMeter
6 2 (1.27%) JUnit
6 2 (1.27%) Subversion
6 2 (1.27%) Travis CI
7 1 (0.64%) Cucumber
7 1 (0.64%) NUnit
General
1 62 (39.49%) Social Skills
2 52 (33.12%) Inclusion and Diversity
3 23 (14.65%) Telecoms
4 9 (5.73%) Finance
5 7 (4.46%) Analytical Skills
6 6 (3.82%) Aviation
6 6 (3.82%) Law
6 6 (3.82%) Marketing
7 5 (3.18%) Banking
7 5 (3.18%) Electronics
7 5 (3.18%) Public Sector
8 4 (2.55%) Games
9 3 (1.91%) Financial Institution
9 3 (1.91%) Manufacturing
9 3 (1.91%) Private Banking
10 2 (1.27%) Legal
10 2 (1.27%) Presentation Skills
11 1 (0.64%) Organisational Skills
11 1 (0.64%) Retail Banking
11 1 (0.64%) Tech for Good
Job Titles
1 50 (31.85%) Senior
2 48 (30.57%) Developer
3 36 (22.93%) Software Engineer
4 25 (15.92%) Java Developer
5 24 (15.29%) React Developer
6 23 (14.65%) Senior Developer
7 21 (13.38%) Senior React Developer
8 20 (12.74%) Senior Java Developer
9 19 (12.10%) J2EE Developer
9 19 (12.10%) Java/J2EE Developer
9 19 (12.10%) JavaScript Developer
9 19 (12.10%) Senior J2EE Developer
9 19 (12.10%) Senior Java/J2EE Developer
9 19 (12.10%) Senior JavaScript Developer
10 18 (11.46%) Architect
11 17 (10.83%) Embedded Engineer
12 16 (10.19%) Enterprise Architect
12 16 (10.19%) Enterprise Solutions Architect
12 16 (10.19%) Solutions Architect
13 15 (9.55%) Graduate
Libraries, Frameworks & Software Standards
1 41 (26.11%) React
2 23 (14.65%) CSS
2 23 (14.65%) HTML
3 19 (12.10%) J2EE
3 19 (12.10%) jOOQ
3 19 (12.10%) React Native
3 19 (12.10%) Redux
4 8 (5.10%) AngularJS
5 5 (3.18%) .NET
5 5 (3.18%) Spring
5 5 (3.18%) Vue
6 4 (2.55%) Node.js
6 4 (2.55%) Spring Boot
7 2 (1.27%) Flask
7 2 (1.27%) GeoJSON
7 2 (1.27%) Kafka
7 2 (1.27%) Playwright
7 2 (1.27%) RabbitMQ
7 2 (1.27%) REST
7 2 (1.27%) Twitter Bootstrap
Miscellaneous
1 25 (15.92%) Self-Motivation
2 13 (8.28%) Management Information System
3 11 (7.01%) Greenfield Project
4 7 (4.46%) Cloud Native
5 6 (3.82%) Legacy Systems
5 6 (3.82%) Virtual Team
6 5 (3.18%) Algorithms
6 5 (3.18%) Public Cloud
7 4 (2.55%) Data Structures
7 4 (2.55%) Enterprise Storage
7 4 (2.55%) Smartphone
8 3 (1.91%) PropTech
9 2 (1.27%) Arduino
9 2 (1.27%) Product Ownership
9 2 (1.27%) Raspberry Pi
10 1 (0.64%) Clustering
10 1 (0.64%) Enterprise Software
10 1 (0.64%) GNSS
10 1 (0.64%) Market Risk
10 1 (0.64%) Renewable Energy
Operating Systems
1 19 (12.10%) Mac OS
2 7 (4.46%) Linux
3 6 (3.82%) Windows
4 5 (3.18%) Windows Server
5 4 (2.55%) Mac OS X
5 4 (2.55%) Windows Server 2012
5 4 (2.55%) Windows Server 2016
5 4 (2.55%) Windows Server 2019
6 2 (1.27%) Unix
Processes & Methodologies
1 65 (41.40%) Mathematics
2 61 (38.85%) Software Engineering
3 56 (35.67%) Problem-Solving
4 47 (29.94%) Agile
5 34 (21.66%) Physics
6 26 (16.56%) DevOps
7 25 (15.92%) Actionable Insight
8 21 (13.38%) Customer Service
9 20 (12.74%) Cybersecurity
9 20 (12.74%) Front End Development
9 20 (12.74%) Prototyping
9 20 (12.74%) SDLC
10 19 (12.10%) Translating Business Requirements
10 19 (12.10%) Validation
11 16 (10.19%) Enterprise Architecture
11 16 (10.19%) Network Architecture
11 16 (10.19%) Project Management
11 16 (10.19%) Requirements Analysis
11 16 (10.19%) Requirements Management
11 16 (10.19%) TOGAF
Programming Languages
1 42 (26.75%) Python
2 39 (24.84%) Java
3 33 (21.02%) JavaScript
3 33 (21.02%) SQL
4 21 (13.38%) Bash
5 20 (12.74%) C
6 17 (10.83%) Embedded C
7 13 (8.28%) Ruby
8 12 (7.64%) C++
9 8 (5.10%) C#
10 6 (3.82%) Perl
10 6 (3.82%) PowerShell
11 4 (2.55%) Go
11 4 (2.55%) TypeScript
12 2 (1.27%) PHP
12 2 (1.27%) Rust
12 2 (1.27%) Shell Script
13 1 (0.64%) Embedded C++
13 1 (0.64%) GLSL
13 1 (0.64%) Haskell
Qualifications
1 127 (80.89%) Degree
2 94 (59.87%) Computer Science Degree
3 16 (10.19%) TOGAF Certification
4 11 (7.01%) Master's Degree
4 11 (7.01%) SC Cleared
4 11 (7.01%) Security Cleared
5 3 (1.91%) ISTQB
5 3 (1.91%) JNCIA
5 3 (1.91%) JNCIE
5 3 (1.91%) JNCIP
5 3 (1.91%) JNCIS
5 3 (1.91%) Microsoft Certification
6 2 (1.27%) A+ Certification
6 2 (1.27%) CompTIA Security+
6 2 (1.27%) Network+ Certification
7 1 (0.64%) Azure Certification
7 1 (0.64%) CISA
7 1 (0.64%) CISM
7 1 (0.64%) CISSP
7 1 (0.64%) CompTIA CySA+
Quality Assurance & Compliance
1 7 (4.46%) QA
2 4 (2.55%) Accessibility
3 1 (0.64%) Cyber Essentials
3 1 (0.64%) Cyber Essentials PLUS
3 1 (0.64%) Data Quality
3 1 (0.64%) ISO/IEC 27001
System Software
1 23 (14.65%) Docker
2 19 (12.10%) Firmware
3 10 (6.37%) Embedded Firmware
4 6 (3.82%) Active Directory
5 5 (3.18%) Hyper-V
6 1 (0.64%) VMware Infrastructure
6 1 (0.64%) XenApp
Systems Management
1 8 (5.10%) Kubernetes
2 6 (3.82%) Ansible
3 4 (2.55%) vRealize
3 4 (2.55%) vRealize Orchestrator
4 2 (1.27%) Grafana
Vendors
1 9 (5.73%) Microsoft
2 6 (3.82%) NEC
2 6 (3.82%) Salesforce
3 5 (3.18%) ServiceNow
4 4 (2.55%) Atlassian
4 4 (2.55%) Dell
5 3 (1.91%) Juniper
6 2 (1.27%) Dynatrace
6 2 (1.27%) ESRI
6 2 (1.27%) NVIDIA
6 2 (1.27%) Oracle
6 2 (1.27%) SAP
6 2 (1.27%) Splunk
7 1 (0.64%) Alteryx
7 1 (0.64%) Amplitude
7 1 (0.64%) ConnectWise
7 1 (0.64%) HubSpot
7 1 (0.64%) Palo Alto
7 1 (0.64%) Rapid7
7 1 (0.64%) VMware