Analytical Skills Job Trends in Glasgow

Analytical Skills
Scotland > Glasgow

The table below looks at the prevalence of the term Analytical Skills in permanent job vacancies in Glasgow. Included is a benchmarking guide to the salaries offered in vacancies that cited Analytical Skills over the 6 months leading up to 24 November 2025, comparing them to the same period in the previous two years.

6 months to
24 Nov 2025
Same period 2024 Same period 2023
Rank 19 15 15
Rank change year-on-year -4 0 +22
Permanent jobs citing Analytical Skills 88 84 64
As % of all permanent jobs in Glasgow 10.68% 8.81% 10.05%
As % of the General category 17.64% 16.87% 16.33%
Number of salaries quoted 21 31 52
10th Percentile £31,750 £35,000 £42,600
25th Percentile £35,000 £39,250 £51,250
Median annual salary (50th Percentile) £45,000 £55,000 £59,778
Median % change year-on-year -18.18% -7.99% +19.56%
75th Percentile £72,500 £68,750 £65,563
90th Percentile £73,750 £110,000 £73,000
Scotland median annual salary £33,500 £60,000 £57,500
% change year-on-year -44.17% +4.35% +21.05%

All General Skills
Glasgow

Analytical Skills falls under the General Skills category. For comparison with the information above, the following table provides summary statistics for all permanent job vacancies requiring common skills in Glasgow.

Permanent vacancies with a requirement for common skills 499 498 392
As % of all permanent jobs advertised in Glasgow 60.56% 52.26% 61.54%
Number of salaries quoted 213 216 313
10th Percentile £28,250 £32,500 £31,250
25th Percentile £31,000 £39,250 £37,500
Median annual salary (50th Percentile) £40,000 £55,000 £55,000
Median % change year-on-year -27.27% - +4.76%
75th Percentile £61,250 £72,500 £65,000
90th Percentile £75,000 £94,375 £77,900
Scotland median annual salary £35,000 £52,500 £52,500
% change year-on-year -33.33% - -7.08%

Analytical Skills
Job Vacancy Trend in Glasgow

Historical trend showing the proportion of permanent IT job postings citing Analytical Skills relative to all permanent IT jobs advertised in Glasgow.
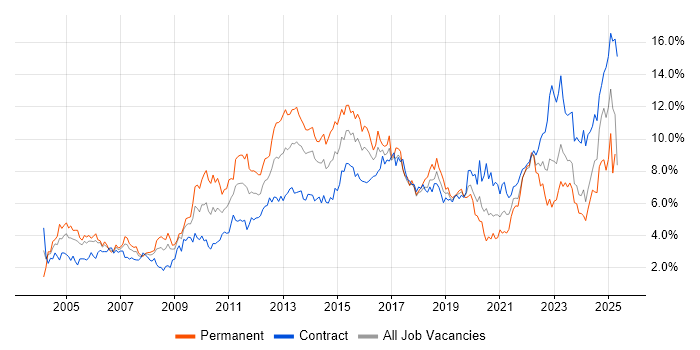
Analytical Skills job vacancy trend in Glasgow

Analytical Skills
Salary Trend in Glasgow

Salary distribution trend for jobs in Glasgow citing Analytical Skills.

Salary distribution trend for jobs in Glasgow citing Analytical Skills

Analytical Skills
Salary Histogram in Glasgow

Salary distribution for jobs citing Analytical Skills in Glasgow over the 6 months to 24 November 2025.

Salary histogram for Analytical Skills in Glasgow

Analytical Skills
Co-Occurring Skills & Capabilities in Glasgow by Category

The following tables expand on the one above by listing co-occurrences grouped by category. They cover the same employment type, locality and period, with up to 20 co-occurrences shown in each category:

Application Platforms
1 6 (6.82%) Camunda
1 6 (6.82%) Oracle Workflow
2 4 (4.55%) Apache Spark
Applications
1 25 (28.41%) Chatbot
2 7 (7.95%) Microsoft Office
3 6 (6.82%) Microsoft Excel
4 1 (1.14%) Microsoft PowerPoint
4 1 (1.14%) MS Visio
Business Applications
1 4 (4.55%) SAP CO
1 4 (4.55%) SAP FI
1 4 (4.55%) SAP FI/CO
1 4 (4.55%) SAP S/4HANA
2 2 (2.27%) Oracle Payables
2 2 (2.27%) Oracle Receivables
3 1 (1.14%) Dynamics CRM
Cloud Services
1 18 (20.45%) AWS
2 9 (10.23%) Power Platform
3 4 (4.55%) Amazon S3
3 4 (4.55%) AWS Lambda
3 4 (4.55%) Azure
3 4 (4.55%) Serverless
4 3 (3.41%) Amazon EC2
4 3 (3.41%) Amazon ECS
4 3 (3.41%) Amazon EMR
4 3 (3.41%) Amazon MSK
5 2 (2.27%) Azure Data Factory
5 2 (2.27%) Azure Synapse Analytics
6 1 (1.14%) Azure DevOps
6 1 (1.14%) Cloud Computing
6 1 (1.14%) Dynamics 365
6 1 (1.14%) GCP
6 1 (1.14%) Power Automate
Communications & Networking
1 2 (2.27%) SAN
Database & Business Intelligence
1 8 (9.09%) Power BI
1 8 (9.09%) Tableau
2 4 (4.55%) Apache Hive
2 4 (4.55%) Big Data
2 4 (4.55%) Hadoop
2 4 (4.55%) HBase
2 4 (4.55%) SAP BW
3 3 (3.41%) Amazon Athena
3 3 (3.41%) Amazon RDS
3 3 (3.41%) Data Mining
3 3 (3.41%) Electronic Patient Records
4 2 (2.27%) Azure SQL Database
4 2 (2.27%) Metadata
4 2 (2.27%) SQL Server
4 2 (2.27%) SQL Server Reporting Services
5 1 (1.14%) DynamoDB
Development Applications
1 10 (11.36%) Maven
2 7 (7.95%) Git
3 6 (6.82%) Jenkins
3 6 (6.82%) JUnit
4 4 (4.55%) Gradle
5 3 (3.41%) Subversion
6 2 (2.27%) JIRA
General
1 35 (39.77%) Finance
2 27 (30.68%) Social Skills
3 23 (26.14%) Law
4 21 (23.86%) Inclusion and Diversity
5 12 (13.64%) Marketing
6 10 (11.36%) Banking
7 5 (5.68%) Public Sector
8 4 (4.55%) Legal
8 4 (4.55%) Private Banking
9 3 (3.41%) Presentation Skills
9 3 (3.41%) Retail
10 2 (2.27%) Advertising
10 2 (2.27%) General Ledger
11 1 (1.14%) Aviation
11 1 (1.14%) Billing
11 1 (1.14%) Influencing Skills
Job Titles
1 25 (28.41%) Trainer
2 16 (18.18%) Software Engineer
3 13 (14.77%) Java Engineer
3 13 (14.77%) Java Software Engineer
4 11 (12.50%) Developer
5 9 (10.23%) Analyst
6 7 (7.95%) Developer/Software Engineer
6 7 (7.95%) Full-Stack Engineer
6 7 (7.95%) Full-Stack Software Engineer
6 7 (7.95%) Java Developer
6 7 (7.95%) Java Software Developer
6 7 (7.95%) Lead
6 7 (7.95%) Software Developer
7 6 (6.82%) Innovation Manager
7 6 (6.82%) Senior
7 6 (6.82%) Trainee
8 5 (5.68%) Applications Support
8 5 (5.68%) Data Analyst
8 5 (5.68%) Senior Manager
9 4 (4.55%) Project Manager
Libraries, Frameworks & Software Standards
1 16 (18.18%) Spring
2 10 (11.36%) REST
3 9 (10.23%) Spring Boot
4 6 (6.82%) JDBC
4 6 (6.82%) OpenAPI
4 6 (6.82%) Swagger
4 6 (6.82%) WSDL
5 4 (4.55%) JPA
5 4 (4.55%) React
6 3 (3.41%) AngularJS
6 3 (3.41%) Hibernate
6 3 (3.41%) HTML
6 3 (3.41%) jQuery
6 3 (3.41%) Kafka
7 1 (1.14%) AWS CDK
7 1 (1.14%) PySpark
Miscellaneous
1 6 (6.82%) Algorithms
2 4 (4.55%) Analytical Mindset
2 4 (4.55%) Legacy Systems
2 4 (4.55%) Management Information System
2 4 (4.55%) Self-Motivation
3 3 (3.41%) Driving Licence
3 3 (3.41%) Equities
4 2 (2.27%) Data Centre
4 2 (2.27%) Life Science
4 2 (2.27%) Smartphone
4 2 (2.27%) Virtual Team
5 1 (1.14%) AI Agents
5 1 (1.14%) Cloud Native
5 1 (1.14%) PMI
Operating Systems
1 4 (4.55%) Unix
Processes & Methodologies
1 47 (53.41%) AI
2 41 (46.59%) Problem-Solving
3 25 (28.41%) Chemistry
3 25 (28.41%) Conversational UI
4 22 (25.00%) Decision-Making
5 20 (22.73%) Agile
6 17 (19.32%) Analytics
6 17 (19.32%) SDLC
7 16 (18.18%) Software Engineering
8 14 (15.91%) Continuous Improvement
9 13 (14.77%) CI/CD
9 13 (14.77%) Project Management
9 13 (14.77%) Visualisation
10 12 (13.64%) Business Intelligence
11 11 (12.50%) ERP
11 11 (12.50%) Machine Learning
12 10 (11.36%) Operational Stability
12 10 (11.36%) Stakeholder Management
13 9 (10.23%) Community of Practice
13 9 (10.23%) ETL
Programming Languages
1 16 (18.18%) Java
1 16 (18.18%) SQL
2 4 (4.55%) JavaScript
2 4 (4.55%) PL/SQL
2 4 (4.55%) Python
3 2 (2.27%) Data Analysis Expressions
4 1 (1.14%) R
Qualifications
1 38 (43.18%) Degree
2 29 (32.95%) Master's Degree
3 25 (28.41%) PhD
4 3 (3.41%) Computer Science Degree
4 3 (3.41%) Microsoft Certification
5 2 (2.27%) A+ Certification
5 2 (2.27%) BPSS Clearance
5 2 (2.27%) CCNA
5 2 (2.27%) Cisco Certification
5 2 (2.27%) MCSE
5 2 (2.27%) Network+ Certification
6 1 (1.14%) AWS Certification
6 1 (1.14%) PMI Certification
6 1 (1.14%) Security Cleared
6 1 (1.14%) Six Sigma Green Belt
Quality Assurance & Compliance
1 5 (5.68%) PMO
2 3 (3.41%) Data Quality
3 2 (2.27%) PERC
4 1 (1.14%) Accessibility
4 1 (1.14%) Actionable Recommendations
System Software
1 4 (4.55%) HDFS
Systems Management
1 9 (10.23%) Kubernetes
2 6 (6.82%) Terraform
Vendors
1 25 (28.41%) PayPal
2 14 (15.91%) Oracle
3 10 (11.36%) Microsoft
4 6 (6.82%) Dynatrace
4 6 (6.82%) Splunk
5 5 (5.68%) Alteryx
5 5 (5.68%) Cisco
5 5 (5.68%) Infor
6 4 (4.55%) Cloudera
6 4 (4.55%) Databricks
6 4 (4.55%) SAP
7 3 (3.41%) Teradata
8 2 (2.27%) Dell
9 1 (1.14%) ServiceNow