Retail Jobs in Leeds

Retailing
West Yorkshire > Leeds

The table below looks at the prevalence of the term Retail in permanent job vacancies advertised in Leeds. Included is a benchmarking guide to the salaries offered in vacancies that have cited Retail over the 6 months to 29 April 2024 with a comparison to the same period over the previous 2 years.

6 months to
29 Apr 2024
Same period 2023 Same period 2022
Rank 69 18 40
Rank change year-on-year -51 +22 +79
Permanent jobs citing Retail 66 349 252
As % of all permanent jobs advertised in Leeds 2.90% 11.50% 6.67%
As % of the General category 4.98% 16.63% 11.41%
Number of salaries quoted 38 232 131
10th Percentile £28,750 £37,935 £31,250
25th Percentile £38,000 £45,000 £37,500
Median annual salary (50th Percentile) £47,500 £65,000 £47,500
Median % change year-on-year -26.92% +36.84% -
75th Percentile £66,875 £80,000 £63,750
90th Percentile £82,500 £96,845 £77,500
West Yorkshire median annual salary £47,500 £65,000 £45,000
% change year-on-year -26.92% +44.44% -

All General Skills
Leeds

Retail is in the General Skills category. The following table is for comparison with the above and provides summary statistics for all permanent job vacancies advertised in Leeds with a requirement for common skills.

Permanent vacancies with a requirement for common skills 1,324 2,098 2,209
As % of all permanent jobs advertised in Leeds 58.17% 69.15% 58.50%
Number of salaries quoted 979 1,156 1,451
10th Percentile £31,000 £31,250 £32,033
25th Percentile £40,000 £40,000 £41,250
Median annual salary (50th Percentile) £52,500 £55,000 £52,500
Median % change year-on-year -4.55% +4.76% +5.00%
75th Percentile £71,250 £72,500 £67,500
90th Percentile £87,500 £85,000 £82,500
West Yorkshire median annual salary £50,000 £55,000 £50,000
% change year-on-year -9.09% +10.00% +4.17%

Retail
Job Vacancy Trend in Leeds

Job postings citing Retail as a proportion of all IT jobs advertised in Leeds.
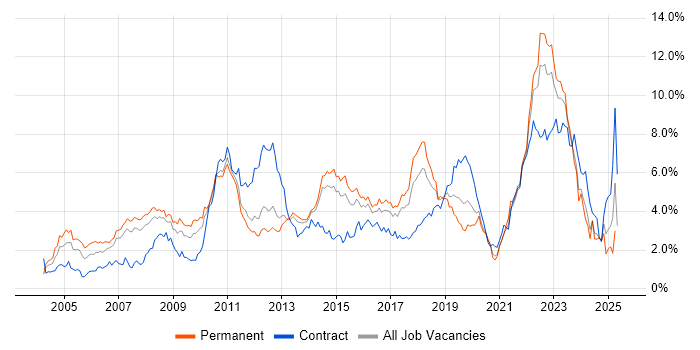
Job vacancy trend for Retail in Leeds

Retail
Salary Trend in Leeds

3-month moving average salary quoted in jobs citing Retail in Leeds.

Salary trend for Retail in Leeds

Retail
Salary Histogram in Leeds

Salary distribution for jobs citing Retail in Leeds over the 6 months to 29 April 2024.

Salary histogram for Retail in Leeds

Retail
Co-occurring Skills and Capabilities in Leeds by Category

The follow tables expand on the table above by listing co-occurrences grouped by category. The same employment type, locality and period is covered with up to 20 co-occurrences shown in each of the following categories:

Application Platforms
1 4 (6.06%) SAS
2 3 (4.55%) SharePoint
3 2 (3.03%) Apache
3 2 (3.03%) Apache Spark
4 1 (1.52%) Jupyter
Applications
1 3 (4.55%) Microsoft Excel
2 2 (3.03%) Acrobat
2 2 (3.03%) Adobe Creative Suite
2 2 (3.03%) Adobe Illustrator
2 2 (3.03%) InDesign
2 2 (3.03%) Microsoft Office
2 2 (3.03%) Photoshop
3 1 (1.52%) EViews
3 1 (1.52%) SPSS
3 1 (1.52%) Trello
Business Applications
1 2 (3.03%) SAP MDG
1 2 (3.03%) SAP MDM
1 2 (3.03%) SAP Retail
1 2 (3.03%) SAP S/4HANA
1 2 (3.03%) Shopify
2 1 (1.52%) Dynamics GP
2 1 (1.52%) Magento
Cloud Services
1 18 (27.27%) Azure
2 8 (12.12%) SaaS
3 7 (10.61%) Power Platform
4 5 (7.58%) AWS
5 3 (4.55%) Azure DevOps
5 3 (4.55%) Microsoft 365
5 3 (4.55%) OneDrive
6 2 (3.03%) Azure AKS
6 2 (3.03%) Azure Cosmos DB
6 2 (3.03%) Azure Monitor
6 2 (3.03%) Datadog
6 2 (3.03%) Dynamics 365
6 2 (3.03%) Pulumi
7 1 (1.52%) GCP
7 1 (1.52%) GitHub
7 1 (1.52%) Google Workspace
7 1 (1.52%) PowerApps
7 1 (1.52%) Slack
7 1 (1.52%) Vertex AI
Communications & Networking
1 8 (12.12%) Internet
2 2 (3.03%) Firewall
3 1 (1.52%) DNS
Database & Business Intelligence
1 7 (10.61%) Power BI
2 3 (4.55%) Data Warehouse
3 2 (3.03%) Azure SQL Database
3 2 (3.03%) MariaDB
3 2 (3.03%) MongoDB
3 2 (3.03%) MySQL
3 2 (3.03%) PostgreSQL
3 2 (3.03%) Redis
3 2 (3.03%) SQL Server
3 2 (3.03%) SQL Server Integration Services
4 1 (1.52%) BusinessObjects
Development Applications
1 4 (6.06%) JIRA
2 2 (3.03%) Git
2 2 (3.03%) Jenkins
2 2 (3.03%) Team Foundation Server
3 1 (1.52%) Bitbucket
3 1 (1.52%) GitLab
3 1 (1.52%) TestCafe
3 1 (1.52%) Visual Studio Code
General
1 33 (50.00%) Social Skills
2 22 (33.33%) Finance
3 8 (12.12%) Analytical Skills
3 8 (12.12%) Manufacturing
4 5 (7.58%) Banking
4 5 (7.58%) Inclusion and Diversity
5 4 (6.06%) Presentation Skills
6 3 (4.55%) Public Sector
7 2 (3.03%) Legal
7 2 (3.03%) Marketing
7 2 (3.03%) Retail Finance
8 1 (1.52%) Financial Institution
8 1 (1.52%) Local Government
8 1 (1.52%) Multimedia
8 1 (1.52%) Tech for Good
8 1 (1.52%) Telecoms
Job Titles
1 11 (16.67%) Analyst
2 9 (13.64%) Project Manager
3 8 (12.12%) Senior
4 7 (10.61%) Architect
5 6 (9.09%) Consultant
5 6 (9.09%) Developer
5 6 (9.09%) Lead
5 6 (9.09%) Service Manager
6 5 (7.58%) Customer Engineer
6 5 (7.58%) Data Engineer
6 5 (7.58%) Senior Analyst
6 5 (7.58%) Solutions Architect
7 4 (6.06%) Lead Data Engineer
8 3 (4.55%) Data Architect
8 3 (4.55%) IT Engineer
8 3 (4.55%) IT Support
8 3 (4.55%) IT Support Engineer
8 3 (4.55%) Support Engineer
9 2 (3.03%) Artworker
9 2 (3.03%) SAP MDM Consultant
Libraries, Frameworks & Software Standards
1 5 (7.58%) PySpark
2 3 (4.55%) React Native
3 2 (3.03%) ARM Templates
3 2 (3.03%) SAP ALE
4 1 (1.52%) .NET
4 1 (1.52%) .NET Core
4 1 (1.52%) Flash
4 1 (1.52%) gRPC
4 1 (1.52%) Node.js
4 1 (1.52%) React
4 1 (1.52%) REST
Miscellaneous
1 9 (13.64%) FMCG
2 8 (12.12%) Product Ownership
3 4 (6.06%) Credit Risk
4 3 (4.55%) Linux Command Line
5 2 (3.03%) Legacy Systems
6 1 (1.52%) Algorithms
6 1 (1.52%) Blog
6 1 (1.52%) Learning Management System
6 1 (1.52%) Market Risk
6 1 (1.52%) NHS
6 1 (1.52%) Renewable Energy
6 1 (1.52%) Security Operations Centre
6 1 (1.52%) Smart Meter
Operating Systems
1 7 (10.61%) Windows
1 7 (10.61%) Windows Server
2 4 (6.06%) Windows Server 2008
3 2 (3.03%) Linux
Processes & Methodologies
1 14 (21.21%) Analytics
2 12 (18.18%) Problem-Solving
3 11 (16.67%) Stakeholder Management
4 10 (15.15%) Agile
4 10 (15.15%) Decision-Making
4 10 (15.15%) Risk Management
5 9 (13.64%) DevOps
5 9 (13.64%) Machine Learning
5 9 (13.64%) Time Management
6 8 (12.12%) Contract Negotiation
7 7 (10.61%) CI/CD
8 6 (9.09%) B2B
8 6 (9.09%) Business Intelligence
8 6 (9.09%) ITIL
8 6 (9.09%) Predictive Analytics
8 6 (9.09%) Roadmaps
8 6 (9.09%) Service Management
9 5 (7.58%) Personalization
9 5 (7.58%) Statistical Modelling
9 5 (7.58%) Validation
Programming Languages
1 12 (18.18%) SQL
2 11 (16.67%) Python
3 6 (9.09%) Java
3 6 (9.09%) JavaScript
3 6 (9.09%) TypeScript
4 4 (6.06%) Bash
5 3 (4.55%) C#
5 3 (4.55%) PHP
5 3 (4.55%) R
6 2 (3.03%) Go
6 2 (3.03%) Groovy
6 2 (3.03%) PowerShell
6 2 (3.03%) Ruby
6 2 (3.03%) VBA
7 1 (1.52%) Data Analysis Expressions
7 1 (1.52%) MATLAB
Qualifications
1 13 (19.70%) Degree
2 8 (12.12%) HNC
2 8 (12.12%) HND
3 2 (3.03%) Azure Certification
4 1 (1.52%) AAT
4 1 (1.52%) ICAEW
4 1 (1.52%) ITIL Certification
4 1 (1.52%) Master's Degree
4 1 (1.52%) SC Cleared
4 1 (1.52%) Security Cleared
Quality Assurance & Compliance
1 3 (4.55%) CRD IV
1 3 (4.55%) QA
2 2 (3.03%) Data Quality
2 2 (3.03%) IFRS
2 2 (3.03%) IFRS 9
3 1 (1.52%) Accessibility
3 1 (1.52%) Actionable Recommendations
3 1 (1.52%) GDPR
System Software
1 4 (6.06%) Docker
2 3 (4.55%) Active Directory
2 3 (4.55%) Hyper-V
Systems Management
1 4 (6.06%) Puppet
1 4 (6.06%) Terraform
2 3 (4.55%) Ansible
2 3 (4.55%) Kubernetes
3 2 (3.03%) Grafana
3 2 (3.03%) HP ALM
3 2 (3.03%) Progress Chef
3 2 (3.03%) Prometheus
4 1 (1.52%) Salt
Vendors
1 11 (16.67%) Google
2 8 (12.12%) Microsoft
3 6 (9.09%) Databricks
4 3 (4.55%) Adobe
4 3 (4.55%) New Relic
4 3 (4.55%) SAP
5 2 (3.03%) JDA
5 2 (3.03%) SaltStack
6 1 (1.52%) BT
6 1 (1.52%) CA
6 1 (1.52%) Capita
6 1 (1.52%) Dataiku
6 1 (1.52%) DocuSign
6 1 (1.52%) HubSpot
6 1 (1.52%) Salesforce