Inclusion and Diversity Jobs in Leeds

Inclusion and Diversity
West Yorkshire > Leeds

The table below looks at the prevalence of the term Inclusion and Diversity in permanent job vacancies advertised in Leeds. Included is a benchmarking guide to the salaries offered in vacancies that have cited Inclusion and Diversity over the 6 months to 27 April 2024 with a comparison to the same period over the previous 2 years.

6 months to
27 Apr 2024
Same period 2023 Same period 2022
Rank 78 67 36
Rank change year-on-year -11 -31 +114
Permanent jobs citing Inclusion and Diversity 56 130 274
As % of all permanent jobs advertised in Leeds 2.46% 4.27% 7.31%
As % of the General category 4.23% 6.16% 12.57%
Number of salaries quoted 14 34 213
10th Percentile £25,008 £61,180 £37,323
25th Percentile £29,118 £65,000 £42,500
Median annual salary (50th Percentile) £51,717 £70,000 £50,173
Median % change year-on-year -26.12% +39.52% +5.63%
75th Percentile £64,988 £80,000 £70,250
90th Percentile £71,725 - £95,468
West Yorkshire median annual salary £33,750 £70,000 £50,173
% change year-on-year -51.79% +39.52% +5.63%

All General Skills
Leeds

Inclusion and Diversity is in the General Skills category. The following table is for comparison with the above and provides summary statistics for all permanent job vacancies advertised in Leeds with a requirement for common skills.

Permanent vacancies with a requirement for common skills 1,325 2,111 2,179
As % of all permanent jobs advertised in Leeds 58.24% 69.33% 58.17%
Number of salaries quoted 976 1,159 1,433
10th Percentile £31,000 £31,250 £32,000
25th Percentile £40,000 £40,000 £41,250
Median annual salary (50th Percentile) £52,500 £55,000 £52,500
Median % change year-on-year -4.55% +4.76% +5.00%
75th Percentile £71,250 £72,500 £67,500
90th Percentile £87,500 £85,000 £82,500
West Yorkshire median annual salary £50,000 £55,000 £50,000
% change year-on-year -9.09% +10.00% +5.26%

Inclusion and Diversity
Job Vacancy Trend in Leeds

Job postings citing Inclusion and Diversity as a proportion of all IT jobs advertised in Leeds.
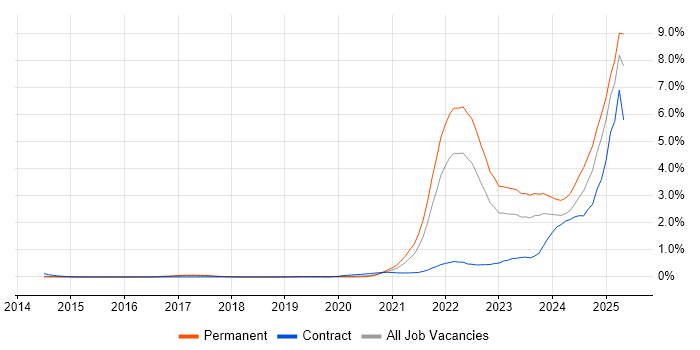
Job vacancy trend for Inclusion and Diversity in Leeds

Inclusion and Diversity
Salary Trend in Leeds

3-month moving average salary quoted in jobs citing Inclusion and Diversity in Leeds.

Salary trend for Inclusion and Diversity in Leeds

Inclusion and Diversity
Salary Histogram in Leeds

Salary distribution for jobs citing Inclusion and Diversity in Leeds over the 6 months to 27 April 2024.

Salary histogram for Inclusion and Diversity in Leeds

Inclusion and Diversity
Co-occurring Skills and Capabilities in Leeds by Category

The follow tables expand on the table above by listing co-occurrences grouped by category. The same employment type, locality and period is covered with up to 20 co-occurrences shown in each of the following categories:

Application Platforms
1 1 (1.79%) CMS
1 1 (1.79%) Jupyter
1 1 (1.79%) SharePoint
Applications
1 6 (10.71%) AutoCAD
2 2 (3.57%) Microsoft Excel
Cloud Services
1 6 (10.71%) AWS
2 3 (5.36%) Azure
3 2 (3.57%) AWS Lambda
3 2 (3.57%) Power Platform
3 2 (3.57%) Serverless
4 1 (1.79%) Amazon CloudWatch
4 1 (1.79%) Amazon EC2
4 1 (1.79%) Amazon ECS
4 1 (1.79%) Amazon ElastiCache
4 1 (1.79%) Amazon EMR
4 1 (1.79%) Amazon Kinesis
4 1 (1.79%) Amazon S3
4 1 (1.79%) Amazon SQS
4 1 (1.79%) AWS CloudFormation
4 1 (1.79%) AWS Fargate
4 1 (1.79%) AWS Step Functions
4 1 (1.79%) Azure DevOps
4 1 (1.79%) CloudFront
4 1 (1.79%) GCP
Communications & Networking
1 4 (7.14%) Broadband
2 3 (5.36%) Wi-Fi
3 2 (3.57%) Software-Defined Networking
3 2 (3.57%) WAN
3 2 (3.57%) Wireless
4 1 (1.79%) DNS
4 1 (1.79%) Firewall
4 1 (1.79%) NGN
Database & Business Intelligence
1 2 (3.57%) Power BI
2 1 (1.79%) Amazon RDS
2 1 (1.79%) DynamoDB
2 1 (1.79%) Electronic Patient Records
2 1 (1.79%) NoSQL
2 1 (1.79%) PostgreSQL
2 1 (1.79%) RDBMS
2 1 (1.79%) Relational Database
2 1 (1.79%) SQL Server
Development Applications
1 2 (3.57%) Git
1 2 (3.57%) JIRA
2 1 (1.79%) Cucumber
2 1 (1.79%) Cypress.io
2 1 (1.79%) GitLab
2 1 (1.79%) Jasmine
2 1 (1.79%) Jenkins
2 1 (1.79%) TestCafe
General
1 31 (55.36%) Social Skills
2 21 (37.50%) Finance
3 16 (28.57%) Presentation Skills
4 15 (26.79%) Billing
5 14 (25.00%) Public Sector
6 13 (23.21%) Local Government
7 7 (12.50%) Analytical Skills
7 7 (12.50%) Legal
8 5 (8.93%) Retail
9 4 (7.14%) Games
10 2 (3.57%) Marketing
11 1 (1.79%) Banking
11 1 (1.79%) Financial Institution
11 1 (1.79%) Law
11 1 (1.79%) Organisational Skills
11 1 (1.79%) Telecoms
Job Titles
1 24 (42.86%) Senior
2 15 (26.79%) Audit Manager
3 6 (10.71%) Coordinator
3 6 (10.71%) Developer
3 6 (10.71%) Senior Developer
3 6 (10.71%) Technical Coordinator
4 4 (7.14%) Node.js Developer
4 4 (7.14%) React Developer
4 4 (7.14%) Senior React Developer
5 3 (5.36%) Technical Assistant
6 2 (3.57%) Analyst
6 2 (3.57%) Architect
6 2 (3.57%) Business Manager
6 2 (3.57%) Consultant
6 2 (3.57%) Relationships Manager
6 2 (3.57%) Senior Architect
6 2 (3.57%) Senior Business Manager
6 2 (3.57%) Senior Manager
6 2 (3.57%) Senior Technical Architect
6 2 (3.57%) Technical Architect
Libraries, Frameworks & Software Standards
1 5 (8.93%) Node.js
1 5 (8.93%) React
2 4 (7.14%) CSS
2 4 (7.14%) GraphQL
2 4 (7.14%) HTML
3 1 (1.79%) Apache NiFi
3 1 (1.79%) Flash
3 1 (1.79%) gRPC
3 1 (1.79%) JMS
3 1 (1.79%) Kafka
3 1 (1.79%) REST
3 1 (1.79%) Spring
3 1 (1.79%) Spring Boot
Miscellaneous
1 19 (33.93%) Housing Association
2 13 (23.21%) NHS
3 9 (16.07%) Driving Licence
4 4 (7.14%) PropTech
5 3 (5.36%) Public Cloud
6 2 (3.57%) Self-Motivation
7 1 (1.79%) Cyber Defence
7 1 (1.79%) Linux Command Line
7 1 (1.79%) Market Risk
7 1 (1.79%) Product Ownership
7 1 (1.79%) Renewable Energy
7 1 (1.79%) Social Media
Operating Systems
1 2 (3.57%) Linux
Processes & Methodologies
1 26 (46.43%) Problem-Solving
2 19 (33.93%) Coaching
3 16 (28.57%) Agile
3 16 (28.57%) Service Management
4 15 (26.79%) Business Development
4 15 (26.79%) People Management
4 15 (26.79%) Performance Management
5 14 (25.00%) Continuous Improvement
6 11 (19.64%) Project Delivery
7 10 (17.86%) Creative Thinking
8 9 (16.07%) Feasibility Study
9 8 (14.29%) Time Management
10 7 (12.50%) Customer Experience
11 6 (10.71%) Continuous Integration
11 6 (10.71%) Mentoring
12 5 (8.93%) Customer Service
12 5 (8.93%) Pair Programming
12 5 (8.93%) Service Delivery
12 5 (8.93%) TDD
12 5 (8.93%) User Research
Programming Languages
1 6 (10.71%) TypeScript
2 5 (8.93%) Java
3 4 (7.14%) Python
4 2 (3.57%) Bash
4 2 (3.57%) JavaScript
4 2 (3.57%) SQL
5 1 (1.79%) PowerShell
5 1 (1.79%) VBA
Qualifications
1 15 (26.79%) ACCA
2 9 (16.07%) Postgraduate
3 6 (10.71%) HNC
3 6 (10.71%) HND
4 4 (7.14%) Degree
5 2 (3.57%) CCIE
5 2 (3.57%) Cisco Certification
6 1 (1.79%) AAT
6 1 (1.79%) APMG
6 1 (1.79%) Azure Certification
6 1 (1.79%) CITP
6 1 (1.79%) ICAEW
6 1 (1.79%) ISEB
6 1 (1.79%) ISEB Practitioner
6 1 (1.79%) Master's Degree
6 1 (1.79%) PMI Certification
6 1 (1.79%) PMP
6 1 (1.79%) SC Cleared
6 1 (1.79%) Security Cleared
Quality Assurance & Compliance
1 15 (26.79%) GAAP
2 14 (25.00%) IFRS
3 2 (3.57%) PMO
4 1 (1.79%) QA
System Software
1 3 (5.36%) Docker
2 1 (1.79%) VMware Infrastructure
Systems Management
1 2 (3.57%) Ansible
1 2 (3.57%) Puppet
1 2 (3.57%) Terraform
2 1 (1.79%) Kubernetes
2 1 (1.79%) Salt
Vendors
1 16 (28.57%) CA
2 7 (12.50%) Microsoft
2 7 (12.50%) SAP
3 2 (3.57%) Cisco
3 2 (3.57%) Facebook
3 2 (3.57%) Meraki
3 2 (3.57%) Palo Alto
3 2 (3.57%) YouTube
4 1 (1.79%) Dataiku
4 1 (1.79%) New Relic
4 1 (1.79%) Veeam
4 1 (1.79%) VMware