DevOps Jobs in Leeds

DevOps
West Yorkshire > Leeds

The following table provides summary statistics for permanent job vacancies advertised in Leeds with a requirement for DevOps skills. Included is a benchmarking guide to the salaries offered in vacancies that have cited DevOps over the 6 months to 27 April 2024 with a comparison to the same period in the previous 2 years.

6 months to
27 Apr 2024
Same period 2023 Same period 2022
Rank 12 6 6
Rank change year-on-year -6 0 +2
Permanent jobs citing DevOps 248 619 689
As % of all permanent jobs advertised in Leeds 10.90% 20.33% 18.39%
As % of the Processes & Methodologies category 12.54% 20.86% 18.88%
Number of salaries quoted 169 321 549
10th Percentile £39,578 £42,500 £41,452
25th Percentile £43,750 £52,500 £50,000
Median annual salary (50th Percentile) £60,000 £65,000 £65,000
Median % change year-on-year -7.69% - +15.56%
75th Percentile £80,000 £80,000 £81,250
90th Percentile £95,000 £92,500 £95,000
West Yorkshire median annual salary £60,000 £62,500 £62,500
% change year-on-year -4.00% - +13.64%

All Process and Methodology Skills
Leeds

DevOps is in the Processes and Methodologies category. The following table is for comparison with the above and provides summary statistics for all permanent job vacancies advertised in Leeds with a requirement for process or methodology skills.

Permanent vacancies with a requirement for process or methodology skills 1,977 2,968 3,649
As % of all permanent jobs advertised in Leeds 86.90% 97.47% 97.41%
Number of salaries quoted 1,399 1,711 2,536
10th Percentile £31,250 £34,308 £32,996
25th Percentile £41,000 £41,750 £42,500
Median annual salary (50th Percentile) £54,900 £57,000 £55,000
Median % change year-on-year -3.68% +3.64% +10.00%
75th Percentile £70,000 £75,000 £70,000
90th Percentile £84,964 £87,500 £85,000
West Yorkshire median annual salary £52,500 £55,000 £52,500
% change year-on-year -4.55% +4.76% +5.00%

DevOps
Job Vacancy Trend in Leeds

Job postings citing DevOps as a proportion of all IT jobs advertised in Leeds.
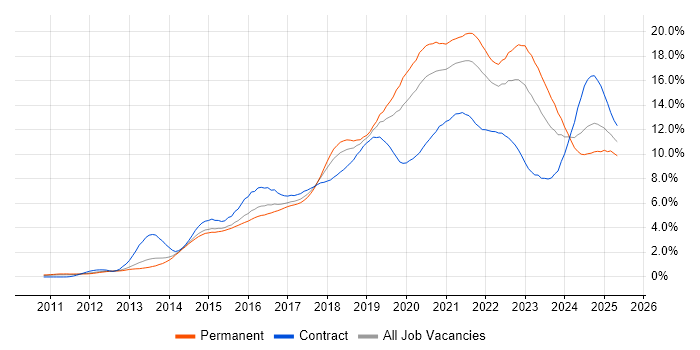
Job vacancy trend for DevOps in Leeds

DevOps
Salary Trend in Leeds

3-month moving average salary quoted in jobs citing DevOps in Leeds.

Salary trend for DevOps in Leeds

DevOps
Salary Histogram in Leeds

Salary distribution for jobs citing DevOps in Leeds over the 6 months to 27 April 2024.

Salary histogram for DevOps in Leeds

DevOps
Co-occurring Skills and Capabilities in Leeds by Category

The follow tables expand on the table above by listing co-occurrences grouped by category. The same employment type, locality and period is covered with up to 20 co-occurrences shown in each of the following categories:

Application Platforms
1 28 (11.29%) ArcGIS
1 28 (11.29%) GeoServer
2 12 (4.84%) Confluence
3 6 (2.42%) IIS
4 3 (1.21%) Captiva
4 3 (1.21%) FileNet
4 3 (1.21%) WebSphere
5 2 (0.81%) Apache
5 2 (0.81%) CMS
5 2 (0.81%) nginx
6 1 (0.40%) IBM Notes
Applications
1 4 (1.61%) Microsoft Excel
2 2 (0.81%) Adobe Illustrator
2 2 (0.81%) Photoshop
2 2 (0.81%) Trello
3 1 (0.40%) MS Visio
Business Applications
1 3 (1.21%) Dynamics AX
2 2 (0.81%) Dynamics CRM
2 2 (0.81%) SystmOne
Cloud Services
1 180 (72.58%) Azure
2 97 (39.11%) AWS
3 63 (25.40%) Azure DevOps
4 43 (17.34%) GCP
5 19 (7.66%) Cloud Computing
6 16 (6.45%) GitHub
7 14 (5.65%) Serverless
8 12 (4.84%) SaaS
9 11 (4.44%) GitHub Actions
10 9 (3.63%) Amazon CloudWatch
10 9 (3.63%) Dynamics 365
11 8 (3.23%) Amazon EC2
11 8 (3.23%) AWS CloudFormation
11 8 (3.23%) Power Platform
11 8 (3.23%) Slack
12 7 (2.82%) Amazon S3
12 7 (2.82%) Azure AKS
12 7 (2.82%) PaaS
13 6 (2.42%) BlazeMeter
13 6 (2.42%) BrowserStack
Communications & Networking
1 9 (3.63%) Firewall
2 7 (2.82%) DNS
3 6 (2.42%) Network Security
4 5 (2.02%) DHCP
4 5 (2.02%) Internet
4 5 (2.02%) TCP/IP
4 5 (2.02%) VPN
5 3 (1.21%) WAN
6 2 (0.81%) FTP
6 2 (0.81%) LAN
6 2 (0.81%) MPLS
7 1 (0.40%) HTTP
7 1 (0.40%) Intranet
7 1 (0.40%) SD-WAN
7 1 (0.40%) Wi-Fi
Database & Business Intelligence
1 35 (14.11%) PostgreSQL
2 28 (11.29%) GIS
2 28 (11.29%) QGIS
3 24 (9.68%) SQL Server
4 18 (7.26%) NoSQL
5 13 (5.24%) Data Warehouse
6 11 (4.44%) MySQL
7 8 (3.23%) Azure SQL Database
7 8 (3.23%) Data Lake
7 8 (3.23%) RDBMS
7 8 (3.23%) Relational Database
8 7 (2.82%) Amazon RDS
8 7 (2.82%) Elasticsearch
8 7 (2.82%) MongoDB
8 7 (2.82%) Redis
9 5 (2.02%) Oracle Database
10 4 (1.61%) Amazon Redshift
10 4 (1.61%) Power BI
11 3 (1.21%) BigQuery
11 3 (1.21%) Looker
Development Applications
1 40 (16.13%) Git
2 20 (8.06%) CircleCI
3 19 (7.66%) JIRA
4 18 (7.26%) GitLab
5 17 (6.85%) Jenkins
6 16 (6.45%) Selenium
7 10 (4.03%) Postman
8 9 (3.63%) Cucumber
8 9 (3.63%) Cypress.io
9 8 (3.23%) JUnit
10 6 (2.42%) Appium
10 6 (2.42%) Jasmine
10 6 (2.42%) JMeter
11 5 (2.02%) Karma Test Runner
11 5 (2.02%) Team Foundation Server
11 5 (2.02%) Visual Studio
12 4 (1.61%) Bitbucket
12 4 (1.61%) IBM UrbanCode
12 4 (1.61%) Katalon Studio
13 3 (1.21%) Artifactory
General
1 59 (23.79%) Social Skills
2 35 (14.11%) Finance
3 29 (11.69%) Public Sector
4 27 (10.89%) Banking
5 22 (8.87%) Law
6 14 (5.65%) Pharmaceutical
7 10 (4.03%) Analytical Skills
7 10 (4.03%) Organisational Skills
7 10 (4.03%) Retail
8 6 (2.42%) Legal
9 5 (2.02%) Presentation Skills
10 4 (1.61%) Telecoms
11 3 (1.21%) Games
12 2 (0.81%) Inclusion and Diversity
13 1 (0.40%) Agriculture
13 1 (0.40%) Health Technology
13 1 (0.40%) Local Government
13 1 (0.40%) Manufacturing
13 1 (0.40%) Retail Banking
Job Titles
1 59 (23.79%) Developer
2 51 (20.56%) Senior
3 43 (17.34%) Lead
3 43 (17.34%) Software Engineer
4 33 (13.31%) DevOps Engineer
5 19 (7.66%) .NET Developer
5 19 (7.66%) Senior Software Engineer
6 13 (5.24%) Azure Engineer
6 13 (5.24%) Full Stack Developer
6 13 (5.24%) Software Developer
7 12 (4.84%) Data Engineer
7 12 (4.84%) Senior Developer
7 12 (4.84%) Software Manager
8 11 (4.44%) Architect
8 11 (4.44%) Platform Engineer
9 9 (3.63%) Engineering Manager
9 9 (3.63%) Lead DevOps
9 9 (3.63%) Lead DevOps Engineer
10 8 (3.23%) C# Developer
10 8 (3.23%) Senior DevOps
Libraries, Frameworks & Software Standards
1 85 (34.27%) .NET
2 51 (20.56%) .NET Core
3 50 (20.16%) React
4 40 (16.13%) CSS
5 28 (11.29%) Leaflet
5 28 (11.29%) OpenLayers
5 28 (11.29%) PostGIS
6 20 (8.06%) AngularJS
7 17 (6.85%) RESTful
8 16 (6.45%) HTML
8 16 (6.45%) Node.js
9 15 (6.05%) JSON
10 11 (4.44%) .NET Framework
10 11 (4.44%) Middleware
10 11 (4.44%) REST
10 11 (4.44%) Web Services
11 10 (4.03%) XML
12 9 (3.63%) SOAP
12 9 (3.63%) Vue
13 8 (3.23%) Spring Boot
Miscellaneous
1 22 (8.87%) Public Cloud
2 19 (7.66%) NHS
3 15 (6.05%) Cloud Native
4 13 (5.24%) Mobile App
5 12 (4.84%) Distributed Systems
5 12 (4.84%) Product Ownership
6 10 (4.03%) Management Information System
7 9 (3.63%) Private Cloud
8 8 (3.23%) Data Centre
9 7 (2.82%) Linux Command Line
10 4 (1.61%) Onboarding
10 4 (1.61%) Virtual Team
11 3 (1.21%) Blog
11 3 (1.21%) DataPower
11 3 (1.21%) Hybrid Cloud
11 3 (1.21%) Self-Motivation
12 2 (0.81%) Greenfield Project
12 2 (0.81%) Mainframe
13 1 (0.40%) Cyber Defence
13 1 (0.40%) Enterprise Software
Operating Systems
1 33 (13.31%) Linux
2 18 (7.26%) Windows
3 6 (2.42%) Unix
4 5 (2.02%) Android
4 5 (2.02%) Apple iOS
4 5 (2.02%) Ubuntu
5 3 (1.21%) Red Hat Enterprise Linux
5 3 (1.21%) VMS
6 2 (0.81%) Windows Server
7 1 (0.40%) CoreOS
7 1 (0.40%) Debian
7 1 (0.40%) zOS
Processes & Methodologies
1 136 (54.84%) Agile
2 79 (31.85%) CI/CD
3 74 (29.84%) Software Engineering
4 45 (18.15%) Microservices
5 44 (17.74%) Infrastructure as Code
6 42 (16.94%) Actionable Insight
6 42 (16.94%) Containerisation
7 39 (15.73%) Mentoring
7 39 (15.73%) Roadmaps
8 38 (15.32%) Web Development
9 35 (14.11%) Test Automation
10 32 (12.90%) Problem-Solving
11 30 (12.10%) Coaching
12 28 (11.29%) Scrum
13 23 (9.27%) Computer Science
13 23 (9.27%) Continuous Integration
14 22 (8.87%) Full Stack Development
15 20 (8.06%) BDD
15 20 (8.06%) Open Source
15 20 (8.06%) SDLC
Programming Languages
1 76 (30.65%) C#
2 74 (29.84%) JavaScript
3 71 (28.63%) SQL
4 46 (18.55%) Python
5 26 (10.48%) TypeScript
6 21 (8.47%) Java
7 14 (5.65%) PowerShell
8 12 (4.84%) Bash
9 11 (4.44%) T-SQL
10 10 (4.03%) PHP
10 10 (4.03%) Ruby
11 9 (3.63%) Groovy
11 9 (3.63%) VB.NET
12 5 (2.02%) Go
12 5 (2.02%) Kotlin
12 5 (2.02%) Swift
12 5 (2.02%) VB
12 5 (2.02%) VB6
13 4 (1.61%) Perl
14 3 (1.21%) Kusto Query Language
Qualifications
1 50 (20.16%) SC Cleared
1 50 (20.16%) Security Cleared
2 30 (12.10%) Degree
3 14 (5.65%) Computer Science Degree
4 13 (5.24%) DBS Check
5 11 (4.44%) Azure Certification
5 11 (4.44%) CIPD
6 6 (2.42%) Microsoft Certification
7 5 (2.02%) CISSP
7 5 (2.02%) TOGAF Certification
8 3 (1.21%) AWS Certification
9 2 (0.81%) AWS Certified Developer
10 1 (0.40%) ISEB
10 1 (0.40%) ISTQB
Quality Assurance & Compliance
1 20 (8.06%) QA
2 17 (6.85%) GDPR
3 8 (3.23%) PSD2
4 3 (1.21%) Data Quality
4 3 (1.21%) SLA
5 2 (0.81%) PMO
6 1 (0.40%) Accessibility
6 1 (0.40%) Cyber Essentials
6 1 (0.40%) ISO/IEC 27001
6 1 (0.40%) ISO/IEC 27002 (supersedes ISO/IEC 17799)
System Software
1 36 (14.52%) Docker
2 7 (2.82%) Hyper-V
3 6 (2.42%) Active Directory
4 5 (2.02%) VMware Infrastructure
5 4 (1.61%) Virtual Machines
5 4 (1.61%) VMware Server
6 2 (0.81%) IAG
Systems Management
1 47 (18.95%) Terraform
2 42 (16.94%) Kubernetes
3 18 (7.26%) Grafana
4 13 (5.24%) Ansible
4 13 (5.24%) Prometheus
5 6 (2.42%) Progress Chef
6 5 (2.02%) Puppet
6 5 (2.02%) SCOM
7 4 (1.61%) Kibana
8 3 (1.21%) Istio
9 2 (0.81%) logstash
10 1 (0.40%) CA Endevor
10 1 (0.40%) CA Single Sign-On
10 1 (0.40%) HP Quality Center
10 1 (0.40%) Podman
10 1 (0.40%) Single Sign-On
Vendors
1 53 (21.37%) Microsoft
2 28 (11.29%) ESRI
3 25 (10.08%) Google
4 14 (5.65%) Oracle
5 8 (3.23%) Databricks
5 8 (3.23%) Duck Creek
6 7 (2.82%) IBM
7 6 (2.42%) Splunk
8 5 (2.02%) New Relic
8 5 (2.02%) SolarWinds
8 5 (2.02%) VMware
9 4 (1.61%) ServiceNow
10 3 (1.21%) Kofax
10 3 (1.21%) Pega
10 3 (1.21%) RedGate
10 3 (1.21%) SAP
11 2 (0.81%) Adobe
11 2 (0.81%) Brio
11 2 (0.81%) Red Hat
11 2 (0.81%) SaltStack