Microsoft Office Jobs in Reading

Microsoft Office
Berkshire > Reading

The following table provides summary statistics for permanent job vacancies advertised in Reading with a requirement for Microsoft Office skills. Included is a benchmarking guide to the salaries offered in vacancies that have cited Microsoft Office over the 6 months to 7 May 2024 with a comparison to the same period in the previous 2 years.

6 months to
7 May 2024
Same period 2023 Same period 2022
Rank 28 57 65
Rank change year-on-year +29 +8 +21
Permanent jobs citing Microsoft Office 107 77 72
As % of all permanent jobs advertised in Reading 6.30% 4.86% 4.07%
As % of the Applications category 55.15% 66.38% 46.75%
Number of salaries quoted 83 61 61
10th Percentile £25,500 - £25,750
25th Percentile £26,000 £25,000 £26,000
Median annual salary (50th Percentile) £30,000 £42,500 £31,500
Median % change year-on-year -29.41% +34.92% -42.73%
75th Percentile £34,500 £45,900 £47,500
90th Percentile £54,100 £60,000 £61,000
Berkshire median annual salary £32,500 £36,975 £38,500
% change year-on-year -12.10% -3.96% -14.44%

All Software Application Skills
Reading

Microsoft Office is in the Software Applications category. The following table is for comparison with the above and provides summary statistics for all permanent job vacancies advertised in Reading with a requirement for software application skills.

Permanent vacancies with a requirement for software application skills 194 116 154
As % of all permanent jobs advertised in Reading 11.43% 7.33% 8.70%
Number of salaries quoted 138 83 113
10th Percentile £25,500 £25,000 £25,750
25th Percentile £26,000 £29,000 £27,500
Median annual salary (50th Percentile) £34,250 £45,600 £41,478
Median % change year-on-year -24.89% +9.94% -5.19%
75th Percentile £52,188 £57,500 £53,750
90th Percentile £70,250 £69,800 £61,250
Berkshire median annual salary £36,000 £39,500 £45,000
% change year-on-year -8.86% -12.22% -

Microsoft Office
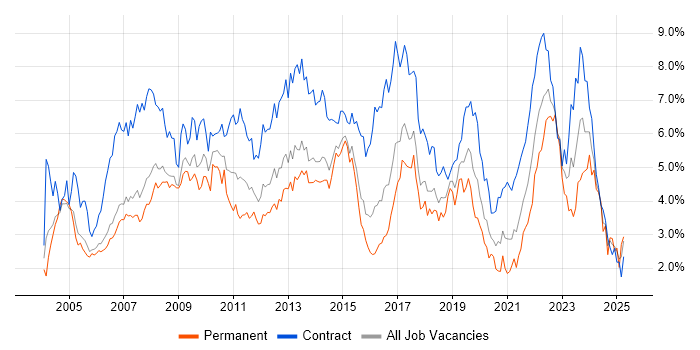
Job Vacancy Trend in Reading

Job postings citing Microsoft Office as a proportion of all IT jobs advertised in Reading.

Job vacancy trend for Microsoft Office in Reading

Microsoft Office
Salary Trend in Reading

3-month moving average salary quoted in jobs citing Microsoft Office in Reading.

Salary trend for Microsoft Office in Reading

Microsoft Office
Salary Histogram in Reading

Salary distribution for jobs citing Microsoft Office in Reading over the 6 months to 7 May 2024.

Salary histogram for Microsoft Office in Reading

Microsoft Office
Co-occurring Skills and Capabilities in Reading by Category

The follow tables expand on the table above by listing co-occurrences grouped by category. The same employment type, locality and period is covered with up to 20 co-occurrences shown in each of the following categories:

Application Platforms
1 15 (14.02%) Oracle Service Bus
1 15 (14.02%) WebLogic
2 10 (9.35%) SharePoint
3 2 (1.87%) CMS
4 1 (0.93%) Microsoft Exchange
Applications
1 28 (26.17%) Microsoft Excel
2 15 (14.02%) MS Visio
3 3 (2.80%) Microsoft PowerPoint
3 3 (2.80%) Microsoft Project
Business Applications
1 15 (14.02%) Remedy ITSM
2 1 (0.93%) Dynamics CRM
2 1 (0.93%) Primavera
2 1 (0.93%) SAP S/4HANA
Cloud Services
1 18 (16.82%) Microsoft 365
2 2 (1.87%) Azure
2 2 (1.87%) Power Platform
3 1 (0.93%) Dynamics 365
3 1 (0.93%) OneDrive
3 1 (0.93%) Power Automate
3 1 (0.93%) PowerApps
3 1 (0.93%) Yammer
Communications & Networking
1 11 (10.28%) VLAN
2 10 (9.35%) LAN
3 4 (3.74%) Wireless
4 2 (1.87%) Firewall
4 2 (1.87%) Multicast
5 1 (0.93%) Network Security
Database & Business Intelligence
1 15 (14.02%) Oracle Database
1 15 (14.02%) Oracle Database 10g
1 15 (14.02%) Oracle Database 11g
1 15 (14.02%) VLDB
2 2 (1.87%) Crystal Reports
3 1 (0.93%) Power BI
3 1 (0.93%) Relational Database
Development Applications
1 4 (3.74%) AdminStudio
1 4 (3.74%) InstallShield
1 4 (3.74%) MSI
General
1 72 (67.29%) Social Skills
2 33 (30.84%) Organisational Skills
3 21 (19.63%) Analytical Skills
4 15 (14.02%) Back Office
5 8 (7.48%) Presentation Skills
6 5 (4.67%) Telecoms
7 4 (3.74%) Documentation Skills
8 3 (2.80%) Finance
8 3 (2.80%) Law
9 1 (0.93%) Automotive
9 1 (0.93%) Manufacturing
9 1 (0.93%) Marketing
9 1 (0.93%) Public Sector
9 1 (0.93%) Retail
Job Titles
1 24 (22.43%) Analyst
2 20 (18.69%) Support Engineer
3 19 (17.76%) Support Analyst
4 17 (15.89%) SQL Analyst
5 16 (14.95%) Consultant
6 15 (14.02%) Applications Support
6 15 (14.02%) Applications Support Analyst
6 15 (14.02%) Oracle Analyst
6 15 (14.02%) Oracle Support Analyst
6 15 (14.02%) SQL Support Analyst
7 14 (13.08%) ICT Consultant
8 12 (11.21%) Desktop Engineer
8 12 (11.21%) IT Engineer
9 11 (10.28%) Desktop Support
9 11 (10.28%) Desktop Support Engineer
10 10 (9.35%) DV Cleared Desktop Support
11 8 (7.48%) IT Support
11 8 (7.48%) IT Support Engineer
12 6 (5.61%) Data Manager
13 5 (4.67%) Senior Consultant
Libraries, Frameworks & Software Standards
1 3 (2.80%) Flash
2 1 (0.93%) Web Services
Miscellaneous
1 21 (19.63%) Self-Motivation
2 17 (15.89%) Driving Licence
3 4 (3.74%) Shadow IT
4 2 (1.87%) Digital Signage
4 2 (1.87%) IPTV
4 2 (1.87%) Learning Management System
5 1 (0.93%) Blog
5 1 (0.93%) Graphic Design
5 1 (0.93%) Onboarding
5 1 (0.93%) Social Media
Operating Systems
1 42 (39.25%) Windows
2 30 (28.04%) Windows 10
3 29 (27.10%) Windows 7
4 15 (14.02%) Linux
4 15 (14.02%) Solaris
4 15 (14.02%) Unix
5 10 (9.35%) Android
6 2 (1.87%) Mac OS
Processes & Methodologies
1 56 (52.34%) Customer Service
2 47 (43.93%) Problem-Solving
3 20 (18.69%) ITIL
3 20 (18.69%) ITSM
4 18 (16.82%) Release Management
5 17 (15.89%) Actionable Insight
5 17 (15.89%) Incident Management
6 16 (14.95%) Asset Management
6 16 (14.95%) Capacity Planning
7 15 (14.02%) Artificial Intelligence
7 15 (14.02%) Performance Monitoring
7 15 (14.02%) Performance Tuning
8 14 (13.08%) Capacity Management
8 14 (13.08%) Software Deployment
9 13 (12.15%) Project Management
10 11 (10.28%) Service Delivery
11 10 (9.35%) Customer Requirements
11 10 (9.35%) Software Testing
12 7 (6.54%) Data Management
13 6 (5.61%) Service Management
Programming Languages
1 18 (16.82%) SQL
2 15 (14.02%) PL/SQL
3 4 (3.74%) C#
3 4 (3.74%) PowerShell
3 4 (3.74%) VB
Qualifications
1 51 (47.66%) Security Cleared
2 38 (35.51%) SC Cleared
3 34 (31.78%) Degree
3 34 (31.78%) DV Cleared
4 15 (14.02%) DBS Check
5 7 (6.54%) A+ Certification
6 5 (4.67%) Network+ Certification
7 3 (2.80%) Microsoft Certification
8 1 (0.93%) Computer Science Degree
8 1 (0.93%) MCDST
8 1 (0.93%) MCP
Quality Assurance & Compliance
1 24 (22.43%) SLA
2 5 (4.67%) GDPR
2 5 (4.67%) PMO
3 3 (2.80%) QA
4 2 (1.87%) Data Quality
System Software
1 15 (14.02%) KVM
1 15 (14.02%) Oracle RAC
2 13 (12.15%) Active Directory
3 10 (9.35%) Firmware
4 4 (3.74%) Microsoft App-V
4 4 (3.74%) VMware Infrastructure
Systems Management
1 15 (14.02%) Data Guard
1 15 (14.02%) Oracle RMAN
2 14 (13.08%) SCCM
3 7 (6.54%) WSUS
Vendors
1 72 (67.29%) Microsoft
2 15 (14.02%) HP
2 15 (14.02%) Oracle
2 15 (14.02%) Remedy
2 15 (14.02%) Sun
3 8 (7.48%) Apple
3 8 (7.48%) Barracuda Networks
4 7 (6.54%) ServiceNow
5 4 (3.74%) Autodesk
5 4 (3.74%) VMware
6 1 (0.93%) Adobe
6 1 (0.93%) Facebook
6 1 (0.93%) Google
6 1 (0.93%) HubSpot
6 1 (0.93%) Salesforce
6 1 (0.93%) SAP