Azure Contracts in Bristol

Microsoft Azure
South West > Bristol

The following table provides summary statistics for contract job vacancies advertised in Bristol with a requirement for Azure skills. Included is a benchmarking guide to the contractor rates offered in vacancies that have cited Azure over the 6 months to 5 May 2024 with a comparison to the same period in the previous 2 years.

6 months to
5 May 2024
Same period 2023 Same period 2022
Rank 10 8 9
Rank change year-on-year -2 +1 -1
Contract jobs citing Azure 120 166 177
As % of all contract jobs advertised in Bristol 11.44% 13.35% 12.51%
As % of the Cloud Services category 43.48% 44.27% 40.41%
Number of daily rates quoted 91 134 154
10th Percentile £215 £354 £319
25th Percentile £400 £414 £419
Median daily rate (50th Percentile) £500 £525 £500
Median % change year-on-year -4.76% +5.00% +8.11%
75th Percentile £575 £630 £588
90th Percentile £613 £675 £673
South West median daily rate £500 £550 £500
% change year-on-year -9.09% +10.00% +5.26%
Number of hourly rates quoted 0 7 0
Median hourly rate - £70.00 -
South West median hourly rate - £60.70 £34.14
% change year-on-year - +77.82% -31.73%

All Cloud Skills
Bristol

Azure is in the Cloud Services category. The following table is for comparison with the above and provides summary statistics for all contract job vacancies advertised in Bristol with a requirement for cloud computing skills.

Contract vacancies with a requirement for cloud computing skills 276 375 438
As % of all contract IT jobs advertised in Bristol 26.31% 30.17% 30.95%
Number of daily rates quoted 196 290 356
10th Percentile £266 £325 £294
25th Percentile £334 £413 £411
Median daily rate (50th Percentile) £475 £513 £500
Median % change year-on-year -7.32% +2.50% +8.70%
75th Percentile £565 £630 £588
90th Percentile £625 £713 £653
South West median daily rate £500 £550 £500
% change year-on-year -9.09% +10.00% +5.26%
Number of hourly rates quoted 14 22 14
10th Percentile £13.08 £20.55 £17.50
25th Percentile £25.06 £29.25 £20.00
Median hourly rate £70.00 £58.75 £25.00
Median % change year-on-year +19.15% +135.00% -41.18%
75th Percentile - £65.00 £42.00
90th Percentile - £70.00 -
South West median hourly rate £15.20 £51.68 £25.00
% change year-on-year -70.60% +106.70% -44.44%

Azure
Job Vacancy Trend in Bristol

Job postings citing Azure as a proportion of all IT jobs advertised in Bristol.
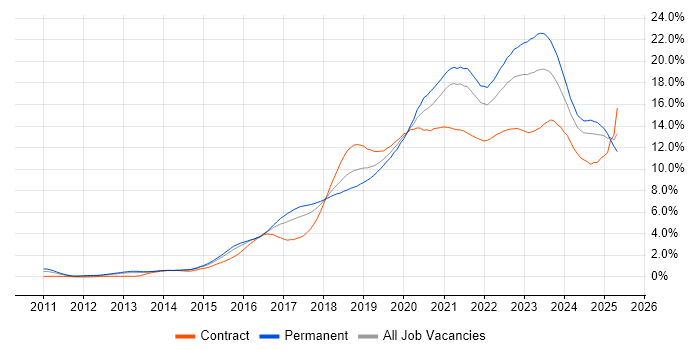
Job vacancy trend for Azure in Bristol

Azure
Contractor Daily Rate Trend in Bristol

3-month moving average daily rate quoted in jobs citing Azure in Bristol.

Daily rate trend for Azure in Bristol

Azure
Daily Rate Histogram in Bristol

Daily rate distribution for jobs citing Azure in Bristol over the 6 months to 5 May 2024.

Daily rate histogram for Azure in Bristol

Azure
Contractor Hourly Rate Trend in Bristol

3-month moving average hourly rates quoted in jobs citing Azure in Bristol.

Hourly rate trend for Azure in Bristol

Azure
Co-occurring Skills and Capabilities in Bristol by Category

The follow tables expand on the table above by listing co-occurrences grouped by category. The same employment type, locality and period is covered with up to 20 co-occurrences shown in each of the following categories:

Application Platforms
1 14 (11.67%) Microsoft Exchange
2 7 (5.83%) SharePoint
3 5 (4.17%) Confluence
4 3 (2.50%) CMS
4 3 (2.50%) Umbraco
5 2 (1.67%) ArcGIS
5 2 (1.67%) Skype for Business
6 1 (0.83%) BizTalk Server
6 1 (0.83%) Cloud Foundry
6 1 (0.83%) ColdFusion
6 1 (0.83%) OpenStack
Applications
1 4 (3.33%) Microsoft Excel
2 3 (2.50%) Microsoft Office
Business Applications
1 4 (3.33%) Dynamics CRM
2 1 (0.83%) Dynamics AX
2 1 (0.83%) Oracle ERP
2 1 (0.83%) Oracle General Ledger
2 1 (0.83%) SAP CRM
2 1 (0.83%) SAP GRC
2 1 (0.83%) SAP SRM
Cloud Services
1 32 (26.67%) Azure DevOps
2 22 (18.33%) Power Platform
3 21 (17.50%) AWS
4 19 (15.83%) Entra ID
5 18 (15.00%) Microsoft 365
6 12 (10.00%) Dynamics 365
7 8 (6.67%) Azure Logic Apps
8 7 (5.83%) GCP
9 5 (4.17%) Azure Data Factory
9 5 (4.17%) Azure Stack
9 5 (4.17%) Microsoft Purview
9 5 (4.17%) PaaS
10 4 (3.33%) Azure Synapse Analytics
10 4 (3.33%) IaaS
10 4 (3.33%) PowerApps
10 4 (3.33%) SaaS
11 3 (2.50%) Azure Service Bus
12 2 (1.67%) Azure Event Grid
12 2 (1.67%) OneDrive
12 2 (1.67%) Power Automate
Communications & Networking
1 17 (14.17%) Firewall
2 7 (5.83%) SAN
2 7 (5.83%) WAN
3 6 (5.00%) FTP
3 6 (5.00%) LAN
4 5 (4.17%) DNS
5 3 (2.50%) DHCP
6 2 (1.67%) Cisco ISE
6 2 (1.67%) Skype
7 1 (0.83%) Cisco IOS
7 1 (0.83%) Intranet
7 1 (0.83%) MQTT
7 1 (0.83%) Structured Cabling
7 1 (0.83%) VPN
7 1 (0.83%) Wi-Fi
7 1 (0.83%) Wireless
Database & Business Intelligence
1 20 (16.67%) Power BI
2 9 (7.50%) Azure SQL Database
3 6 (5.00%) Data Warehouse
4 4 (3.33%) Data Lake
4 4 (3.33%) Snowflake Schema
4 4 (3.33%) SQL Server
5 3 (2.50%) GIS
6 2 (1.67%) SQL Server Integration Services
6 2 (1.67%) Tableau
7 1 (0.83%) Metadata
7 1 (0.83%) Metadata Repository
7 1 (0.83%) Oracle Reports
7 1 (0.83%) PostgreSQL
7 1 (0.83%) Semantic Layer
Development Applications
1 10 (8.33%) JIRA
2 6 (5.00%) Artifactory
2 6 (5.00%) SonarQube
3 4 (3.33%) Git
3 4 (3.33%) NUnit
3 4 (3.33%) Postman
3 4 (3.33%) Visual Studio
4 3 (2.50%) Cypress.io
5 2 (1.67%) Selenium
General
1 23 (19.17%) Social Skills
2 16 (13.33%) Public Sector
3 12 (10.00%) Legal
4 9 (7.50%) Finance
5 8 (6.67%) Manufacturing
5 8 (6.67%) Telecoms
6 6 (5.00%) Electronics
6 6 (5.00%) Marketing
7 5 (4.17%) Analytical Skills
8 4 (3.33%) Banking
8 4 (3.33%) Local Government
9 3 (2.50%) Tech for Good
10 2 (1.67%) General Ledger
10 2 (1.67%) Influencing Skills
10 2 (1.67%) Presentation Skills
11 1 (0.83%) Law
11 1 (0.83%) Retail
Job Titles
1 30 (25.00%) Architect
2 15 (12.50%) Solutions Architect
3 14 (11.67%) Analyst
4 11 (9.17%) Azure Engineer
4 11 (9.17%) Developer
5 10 (8.33%) Data Engineer
5 10 (8.33%) Senior
6 7 (5.83%) Infrastructure Engineer
7 6 (5.00%) DevOps Engineer
7 6 (5.00%) Network Engineer
8 5 (4.17%) Azure Data Engineer
8 5 (4.17%) Cloud Engineer
8 5 (4.17%) Cybersecurity Analyst
8 5 (4.17%) Data Architect
8 5 (4.17%) Lead
8 5 (4.17%) Security Analyst
8 5 (4.17%) Support Analyst
8 5 (4.17%) Technical Support
8 5 (4.17%) Technical Support Analyst
8 5 (4.17%) Test Engineer
Libraries, Frameworks & Software Standards
1 17 (14.17%) .NET
2 7 (5.83%) SailPoint
3 6 (5.00%) YAML
4 5 (4.17%) AngularJS
4 5 (4.17%) ASP.NET
5 4 (3.33%) CSS
5 4 (3.33%) GraphQL
5 4 (3.33%) HTML
5 4 (3.33%) JSON
5 4 (3.33%) Playwright
5 4 (3.33%) REST
5 4 (3.33%) XML
6 3 (2.50%) .NET Core
6 3 (2.50%) ASP.NET MVC
6 3 (2.50%) Blazor
6 3 (2.50%) PySpark
7 2 (1.67%) 802.1X
7 2 (1.67%) React
7 2 (1.67%) Web Services
8 1 (0.83%) HTML5
Miscellaneous
1 7 (5.83%) Public Cloud
2 6 (5.00%) Replication
3 5 (4.17%) Data Structures
4 4 (3.33%) Product Ownership
4 4 (3.33%) Reference Data
5 3 (2.50%) Data Centre
5 3 (2.50%) IoT
5 3 (2.50%) PKI
6 2 (1.67%) Enterprise Cloud
6 2 (1.67%) Linux Command Line
6 2 (1.67%) Management Information System
6 2 (1.67%) Self-Motivation
7 1 (0.83%) Clustering
7 1 (0.83%) CSOC
7 1 (0.83%) Cyber Defence
7 1 (0.83%) Enterprise Storage
7 1 (0.83%) Greenfield Project
7 1 (0.83%) Legacy Systems
7 1 (0.83%) Onboarding
7 1 (0.83%) Smartphone
Operating Systems
1 18 (15.00%) Windows
2 11 (9.17%) Windows Server
3 8 (6.67%) VMS
4 7 (5.83%) Linux
5 5 (4.17%) Android
5 5 (4.17%) Mac OS
6 4 (3.33%) Windows 10
7 2 (1.67%) Unix
7 2 (1.67%) Windows 2000
7 2 (1.67%) Windows Server 2003
7 2 (1.67%) Windows Server 2012
7 2 (1.67%) Windows XP
8 1 (0.83%) Windows Server 2019
Processes & Methodologies
1 41 (34.17%) DevOps
2 32 (26.67%) Agile
3 25 (20.83%) Business Intelligence
4 21 (17.50%) Migration
5 19 (15.83%) CI/CD
6 17 (14.17%) Data Management
7 14 (11.67%) Data Protection
7 14 (11.67%) Problem-Solving
8 11 (9.17%) Project Delivery
8 11 (9.17%) Test Automation
9 10 (8.33%) Architectural Patterns
9 10 (8.33%) Change Management
9 10 (8.33%) Infrastructure Engineering
9 10 (8.33%) ITIL
10 9 (7.50%) Analytics
10 9 (7.50%) Computer Science
10 9 (7.50%) Software Engineering
11 8 (6.67%) Containerisation
11 8 (6.67%) ETL
11 8 (6.67%) Programme Management
Programming Languages
1 25 (20.83%) SQL
2 17 (14.17%) C#
3 10 (8.33%) PowerShell
4 9 (7.50%) Python
4 9 (7.50%) TypeScript
5 7 (5.83%) Bash
6 5 (4.17%) JavaScript
7 2 (1.67%) Shell Script
8 1 (0.83%) Bicep
8 1 (0.83%) Java
Qualifications
1 24 (20.00%) Security Cleared
2 12 (10.00%) DV Cleared
3 10 (8.33%) Degree
4 8 (6.67%) SC Cleared
5 2 (1.67%) CISM
5 2 (1.67%) CISSP
5 2 (1.67%) ITIL Certification
5 2 (1.67%) MCP
6 1 (0.83%) Azure Certification
6 1 (0.83%) BPSS Clearance
6 1 (0.83%) CISA
6 1 (0.83%) Computer Science Degree
Quality Assurance & Compliance
1 7 (5.83%) QA
2 4 (3.33%) Accessibility
2 4 (3.33%) Data Quality
2 4 (3.33%) Government Security Classifications
2 4 (3.33%) NCSC
3 2 (1.67%) SLA
System Software
1 26 (21.67%) Active Directory
2 12 (10.00%) Docker
3 9 (7.50%) VMware ESXi
3 9 (7.50%) VMware Infrastructure
4 6 (5.00%) Virtual Machines
4 6 (5.00%) VMware NSX
5 3 (2.50%) Hyper-V
5 3 (2.50%) vSphere
6 1 (0.83%) Microsoft App-V
6 1 (0.83%) Virtual Desktop
6 1 (0.83%) Virtual Servers
6 1 (0.83%) XenApp
6 1 (0.83%) XenDesktop
Systems Management
1 13 (10.83%) Terraform
2 9 (7.50%) Ansible
2 9 (7.50%) Microsoft Intune
2 9 (7.50%) Single Sign-On
2 9 (7.50%) vCenter Server
3 5 (4.17%) Kubernetes
4 3 (2.50%) SCCM
5 2 (1.67%) Jamf Pro
6 1 (0.83%) Grafana
6 1 (0.83%) Microsoft Clustering
6 1 (0.83%) Prometheus
6 1 (0.83%) Puppet
6 1 (0.83%) vRealize
6 1 (0.83%) WSUS
Vendors
1 38 (31.67%) Microsoft
2 17 (14.17%) VMware
3 9 (7.50%) CA
3 9 (7.50%) Cisco
4 8 (6.67%) Databricks
4 8 (6.67%) SAP
5 6 (5.00%) CheckPoint
5 6 (5.00%) Palo Alto
5 6 (5.00%) Veeam
6 4 (3.33%) CyberArk
6 4 (3.33%) Dell
7 3 (2.50%) Citrix
7 3 (2.50%) Okta
8 2 (1.67%) Fortinet
8 2 (1.67%) Juniper
8 2 (1.67%) Mapbox
8 2 (1.67%) Oracle
9 1 (0.83%) Hitachi
9 1 (0.83%) Informatica
9 1 (0.83%) Veritas