Azure Contract Job Trends in the South West

Microsoft Azure
England > South West

The table below provides summary statistics and contractor rates for jobs advertised in the South West requiring Azure skills. It covers contract job vacancies from the 6 months leading up to 7 November 2025, with comparisons to the same periods in the previous two years.

6 months to
7 Nov 2025
Same period 2024 Same period 2023
Rank 8 12 7
Rank change year-on-year +4 -5 +2
Contract jobs citing Azure 297 251 428
As % of all contract jobs in the South West 13.77% 10.39% 13.66%
As % of the Cloud Services category 43.48% 35.81% 45.44%
Number of daily rates quoted 227 174 339
10th Percentile £325 £366 £376
25th Percentile £413 £425 £475
Median daily rate (50th Percentile) £500 £513 £563
Median % change year-on-year -2.44% -8.89% +7.14%
75th Percentile £650 £609 £675
90th Percentile £713 £700 £725
England median daily rate £525 £538 £550
% change year-on-year -2.33% -2.27% -3.51%
Number of hourly rates quoted 4 1 3
10th Percentile £58.70 - £14.68
25th Percentile £60.50 £77.50 £14.77
Median hourly rate £70.00 £85.00 £15.35
Median % change year-on-year -17.65% +453.75% -78.07%
75th Percentile £81.56 £92.50 £15.84
90th Percentile £88.88 - £15.88
England median hourly rate £34.24 £40.59 £46.18
% change year-on-year -15.64% -12.10% -16.04%

All Cloud Skills
South West

Azure falls under the Cloud Services category. For comparison with the information above, the following table provides summary statistics for all contract job vacancies requiring cloud computing skills in the South West.

Contract vacancies with a requirement for cloud computing skills 683 701 942
As % of all contract IT jobs advertised in the South West 31.66% 29.01% 30.06%
Number of daily rates quoted 478 443 728
10th Percentile £220 £250 £272
25th Percentile £370 £425 £425
Median daily rate (50th Percentile) £500 £550 £550
Median % change year-on-year -9.09% - +4.76%
75th Percentile £613 £638 £671
90th Percentile £700 £701 £725
England median daily rate £500 £535 £528
% change year-on-year -6.45% +1.33% -4.09%
Number of hourly rates quoted 28 33 48
10th Percentile - £20.92 £13.25
25th Percentile - £30.00 £14.58
Median hourly rate £18.87 £70.00 £25.75
Median % change year-on-year -73.04% +171.84% -55.41%
75th Percentile £35.51 - £66.38
90th Percentile £66.90 - £78.00
England median hourly rate £25.15 £35.00 £27.50
% change year-on-year -28.14% +27.27% +22.22%

Azure
Job Vacancy Trend in the South West

Historical trend showing the proportion of contract IT job postings citing Azure relative to all contract IT jobs advertised in the South West.
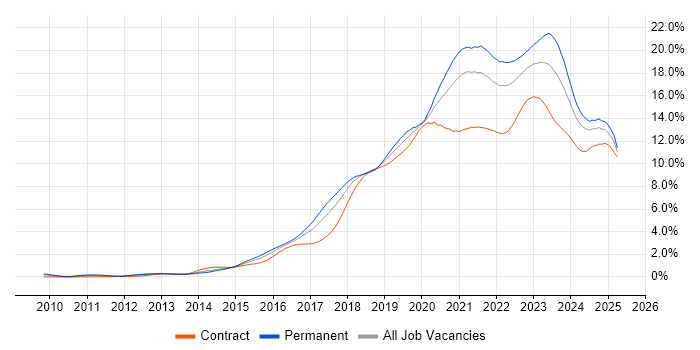
Azure job vacancy trend in the South West

Azure
Daily Rate Trend in the South West

Contractor daily rate distribution trend for jobs in the South West citing Azure.

Contractor daily rate distribution trend for jobs in the South West citing Azure

Azure
Daily Rate Histogram in the South West

Daily rate distribution for jobs citing Azure in the South West over the 6 months to 7 November 2025.

Daily rate histogram for Azure in the South West

Azure
Hourly Rate Trend in the South West

Contractor hourly rate distribution trend for jobs in the South West citing Azure.

Contractor hourly rate distribution trend for jobs in the South West citing Azure

Azure
Hourly Rate Histogram in the South West

Hourly rate distribution of jobs citing Azure in the South West over the 6 months to 7 November 2025.

Hourly rate histogram for Azure in the South West

Azure
Contract Job Locations in the South West

The table below looks at the demand and provides a guide to the median contractor rates quoted in IT jobs citing Azure within the South West region over the 6 months to 7 November 2025. The 'Rank Change' column provides an indication of the change in demand within each location based on the same 6 month period last year.

Location Rank Change
on Same Period
Last Year
Matching
Contract
IT Job Ads
Median
Daily Rate
Past 6 Months
Median Daily Rate
% Change
on Same Period
Last Year
Live
Jobs
Gloucestershire +8 105 £500 -6.19% 111
Bristol -2 80 £492 -6.29% 176
Somerset +3 44 £450 -21.74% 85
Wiltshire +3 34 £565 +18.95% 79
Dorset 0 13 £503 +0.50% 28
Devon -10 9 £525 +25.00% 29
Azure
England

Azure
Co-Occurring Skills & Capabilities in the South West by Category

The following tables expand on the one above by listing co-occurrences grouped by category. They cover the same employment type, locality and period, with up to 20 co-occurrences shown in each category:

Application Platforms
1 25 (8.42%) SharePoint
2 14 (4.71%) Microsoft Exchange
3 5 (1.68%) Confluence
4 3 (1.01%) nginx
5 2 (0.67%) Apache
5 2 (0.67%) Apache Spark
5 2 (0.67%) Documentum
6 1 (0.34%) Anypoint
6 1 (0.34%) CMS
6 1 (0.34%) IIS
6 1 (0.34%) Sitecore CMS
Applications
1 6 (2.02%) Microsoft Excel
2 5 (1.68%) Microsoft Office
3 2 (0.67%) Windchill
4 1 (0.34%) Microsoft Project
Business Applications
1 5 (1.68%) Maximo
2 3 (1.01%) NetSuite
3 2 (0.67%) Teamcenter
4 1 (0.34%) Oracle Applications
4 1 (0.34%) Primavera
Cloud Services
1 104 (35.02%) AWS
2 66 (22.22%) Azure DevOps
3 39 (13.13%) Entra ID
3 39 (13.13%) GCP
3 39 (13.13%) GitHub
4 34 (11.45%) Microsoft 365
5 16 (5.39%) Power Platform
6 15 (5.05%) Azure Sentinel
7 13 (4.38%) Serverless
8 12 (4.04%) Power Automate
9 11 (3.70%) Azure Key Vault
9 11 (3.70%) GitHub Actions
10 10 (3.37%) Azure Data Factory
10 10 (3.37%) OpenShift
11 9 (3.03%) Azure Stack
12 8 (2.69%) OneDrive
13 7 (2.36%) AWS CloudFormation
13 7 (2.36%) Azure Monitor
14 6 (2.02%) Azure AKS
14 6 (2.02%) ShareGate
Communications & Networking
1 17 (5.72%) VPN
2 15 (5.05%) Firewall
3 8 (2.69%) Network Security
4 7 (2.36%) WAN
5 6 (2.02%) HTTP
6 5 (1.68%) DNS
6 5 (1.68%) SD-WAN
7 4 (1.35%) NetScaler
8 3 (1.01%) DHCP
8 3 (1.01%) Kerberos
8 3 (1.01%) TCP/IP
9 2 (0.67%) LAN
9 2 (0.67%) SMTP
9 2 (0.67%) VLAN
10 1 (0.34%) 2G
10 1 (0.34%) BGP
10 1 (0.34%) Intrusion Detection
10 1 (0.34%) MPLS
10 1 (0.34%) OSPF
10 1 (0.34%) Wireless
Database & Business Intelligence
1 21 (7.07%) PostgreSQL
2 13 (4.38%) SQL Server
3 12 (4.04%) Power BI
4 11 (3.70%) Elasticsearch
5 7 (2.36%) Redis
6 6 (2.02%) NoSQL
6 6 (2.02%) Relational Database
7 5 (1.68%) MongoDB
8 4 (1.35%) Data Warehouse
8 4 (1.35%) Metadata
8 4 (1.35%) MySQL
8 4 (1.35%) Oracle Database
9 3 (1.01%) Amazon RDS
9 3 (1.01%) Azure SQL Database
9 3 (1.01%) Tableau
10 2 (0.67%) Big Data
10 2 (0.67%) ClickHouse
10 2 (0.67%) DynamoDB
10 2 (0.67%) Oracle Database 12c
10 2 (0.67%) SQL Server Integration Services
Development Applications
1 24 (8.08%) Oracle APEX
2 22 (7.41%) JIRA
3 20 (6.73%) Git
4 16 (5.39%) SonarQube
5 8 (2.69%) Jenkins
6 6 (2.02%) GitLab
7 3 (1.01%) Cypress.io
8 2 (0.67%) Selenium
8 2 (0.67%) Visual Studio
9 1 (0.34%) Appium
9 1 (0.34%) Artifactory
9 1 (0.34%) Bitbucket
9 1 (0.34%) CircleCI
9 1 (0.34%) CMake
9 1 (0.34%) GoogleTest
9 1 (0.34%) Maven
9 1 (0.34%) MSI
9 1 (0.34%) Oracle Forms
9 1 (0.34%) Sonatype Nexus
9 1 (0.34%) webpack
General
1 114 (38.38%) Social Skills
2 35 (11.78%) Public Sector
3 28 (9.43%) Finance
4 15 (5.05%) Manufacturing
5 13 (4.38%) Analytical Skills
5 13 (4.38%) Telecoms
6 11 (3.70%) Documentation Skills
7 8 (2.69%) Electronics
7 8 (2.69%) Marketing
8 4 (1.35%) Local Government
9 3 (1.01%) Aerospace
9 3 (1.01%) Banking
9 3 (1.01%) Inclusion and Diversity
9 3 (1.01%) Influencing Skills
9 3 (1.01%) Military
10 2 (0.67%) Law
10 2 (0.67%) Legal
10 2 (0.67%) Presentation Skills
10 2 (0.67%) Tech for Good
11 1 (0.34%) Social Housing
Job Titles
1 75 (25.25%) Developer
2 49 (16.50%) Senior
3 36 (12.12%) Architect
4 29 (9.76%) Senior Developer
5 26 (8.75%) Analyst
6 20 (6.73%) Infrastructure Engineer
7 18 (6.06%) Lead
8 17 (5.72%) Azure Engineer
9 14 (4.71%) Data Engineer
9 14 (4.71%) Solutions Architect
10 12 (4.04%) DevSecOps Engineer
11 10 (3.37%) Backend Developer
11 10 (3.37%) Desktop Engineer
11 10 (3.37%) Security Engineer
12 9 (3.03%) Azure Infrastructure Engineer
12 9 (3.03%) Support Engineer
13 8 (2.69%) Consultant
13 8 (2.69%) IT Engineer
13 8 (2.69%) Network Architect
13 8 (2.69%) Senior Data Engineer
Libraries, Frameworks & Software Standards
1 27 (9.09%) React
2 18 (6.06%) ARM Templates
2 18 (6.06%) Node.js
3 16 (5.39%) .NET
3 16 (5.39%) AngularJS
3 16 (5.39%) SOAP
4 15 (5.05%) REST
5 13 (4.38%) OAuth
6 12 (4.04%) CSS
6 12 (4.04%) HTML
6 12 (4.04%) XML
6 12 (4.04%) YAML
7 10 (3.37%) OAuth2
7 10 (3.37%) RESTful
8 9 (3.03%) Kafka
8 9 (3.03%) OpenID
8 9 (3.03%) Spring
9 8 (2.69%) Middleware
9 8 (2.69%) SAML
10 7 (2.36%) Web Services
Miscellaneous
1 30 (10.10%) Hybrid Cloud
2 26 (8.75%) Cloud Native
3 15 (5.05%) Data Centre
4 11 (3.70%) Onboarding
5 8 (2.69%) Product Ownership
6 6 (2.02%) Security Posture
7 5 (1.68%) Enterprise Software
7 5 (1.68%) IoT
7 5 (1.68%) Management Information System
8 4 (1.35%) Cyber Defence
8 4 (1.35%) Legacy Systems
8 4 (1.35%) PKI
8 4 (1.35%) Public Cloud
9 3 (1.01%) CMDB
9 3 (1.01%) Enterprise Cloud
9 3 (1.01%) iPad
9 3 (1.01%) iPhone
9 3 (1.01%) Private Cloud
9 3 (1.01%) Self-Motivation
9 3 (1.01%) Virtual Team
Operating Systems
1 57 (19.19%) Windows
2 22 (7.41%) Windows Server
3 16 (5.39%) Linux
4 14 (4.71%) Windows 10
5 6 (2.02%) Apple iOS
6 4 (1.35%) Android
6 4 (1.35%) Unix
6 4 (1.35%) Windows Server 2012
7 3 (1.01%) Mac OS
7 3 (1.01%) Windows Server 2016
8 2 (0.67%) Red Hat Enterprise Linux
8 2 (0.67%) Windows Server 2019
9 1 (0.34%) Robot Operating System
Processes & Methodologies
1 111 (37.37%) DevOps
2 101 (34.01%) Agile
3 60 (20.20%) CI/CD
4 54 (18.18%) Scrum
5 44 (14.81%) Problem-Solving
6 39 (13.13%) Containerisation
6 39 (13.13%) Infrastructure as Code
7 33 (11.11%) Migration
7 33 (11.11%) Validation
8 29 (9.76%) Stakeholder Engagement
9 28 (9.43%) Collaborative Working
9 28 (9.43%) Stakeholder Management
10 26 (8.75%) Test Automation
11 24 (8.08%) ITIL
12 22 (7.41%) Microservices
12 22 (7.41%) Software Delivery
13 21 (7.07%) Business Intelligence
13 21 (7.07%) DevSecOps
13 21 (7.07%) Infrastructure Engineering
13 21 (7.07%) Mentoring
Programming Languages
1 60 (20.20%) SQL
2 56 (18.86%) Python
3 44 (14.81%) PowerShell
4 43 (14.48%) JavaScript
5 26 (8.75%) PL/SQL
6 20 (6.73%) TypeScript
7 16 (5.39%) Bash
8 15 (5.05%) Go
8 15 (5.05%) Java
9 11 (3.70%) C#
10 10 (3.37%) Bicep
11 3 (1.01%) C
11 3 (1.01%) C++
11 3 (1.01%) Ruby
12 2 (0.67%) T-SQL
12 2 (0.67%) VBA
13 1 (0.34%) Apex Code
13 1 (0.34%) Data Analysis Expressions
13 1 (0.34%) Groovy
13 1 (0.34%) Shell Script
Qualifications
1 162 (54.55%) Security Cleared
2 144 (48.48%) SC Cleared
3 42 (14.14%) DV Cleared
4 31 (10.44%) Azure Certification
5 12 (4.04%) AWS Certification
6 10 (3.37%) Degree
6 10 (3.37%) Microsoft Certification
7 9 (3.03%) CISSP
8 7 (2.36%) CISM
9 6 (2.02%) Network+ Certification
10 5 (1.68%) BPSS Clearance
10 5 (1.68%) ISTQB
11 4 (1.35%) AWS Certified DevOps Engineer
11 4 (1.35%) Computer Science Degree
12 3 (1.01%) AWS Certified Solutions Architect
12 3 (1.01%) Cisco Certification
12 3 (1.01%) ISO 27001 Lead Implementer
12 3 (1.01%) ITIL Certification
12 3 (1.01%) MCSE
13 2 (0.67%) CCNP
Quality Assurance & Compliance
1 25 (8.42%) ISO/IEC 27001
2 21 (7.07%) NCSC
3 18 (6.06%) GDPR
3 18 (6.06%) NIST
4 16 (5.39%) QA
5 7 (2.36%) Accessibility
6 4 (1.35%) NIST 800
6 4 (1.35%) Sarbanes-Oxley
7 3 (1.01%) Government Security Classifications
7 3 (1.01%) PSD2
8 2 (0.67%) Cyber Essentials
8 2 (0.67%) Data Quality
8 2 (0.67%) GRC
8 2 (0.67%) JSP 440
8 2 (0.67%) SLA
8 2 (0.67%) SOC 2
8 2 (0.67%) WCAG
9 1 (0.34%) Cyber Essentials PLUS
9 1 (0.34%) HIPAA
System Software
1 51 (17.17%) Active Directory
2 46 (15.49%) Docker
3 13 (4.38%) Virtual Desktop
4 10 (3.37%) VMware Infrastructure
5 7 (2.36%) Hyper-V
6 6 (2.02%) Virtual Machines
7 4 (1.35%) XenDesktop
8 3 (1.01%) VMware ESXi
9 2 (0.67%) Oracle RAC
10 1 (0.34%) Slurm Workload Manager
10 1 (0.34%) VMware NSX
10 1 (0.34%) vSphere
Systems Management
1 47 (15.82%) Kubernetes
2 45 (15.15%) Terraform
3 24 (8.08%) Microsoft Intune
4 15 (5.05%) Single Sign-On
5 14 (4.71%) Grafana
5 14 (4.71%) SCCM
6 13 (4.38%) Prometheus
7 12 (4.04%) Ansible
8 6 (2.02%) Active Directory Federation Services
9 5 (1.68%) Kibana
10 4 (1.35%) Data Guard
10 4 (1.35%) Oracle RMAN
10 4 (1.35%) Puppet
11 3 (1.01%) Argo
11 3 (1.01%) logstash
11 3 (1.01%) Podman
11 3 (1.01%) WSUS
12 2 (0.67%) FortiGate
12 2 (0.67%) Nessus
12 2 (0.67%) PingFederate
Vendors
1 102 (34.34%) Microsoft
2 35 (11.78%) Oracle
3 13 (4.38%) VMware
4 12 (4.04%) ServiceNow
5 9 (3.03%) SAP
6 7 (2.36%) NetApp
6 7 (2.36%) Red Hat
6 7 (2.36%) Salesforce
7 6 (2.02%) Blue Prism
8 5 (1.68%) Databricks
8 5 (1.68%) ForgeRock
8 5 (1.68%) Google
8 5 (1.68%) IBM
8 5 (1.68%) Ping Identity
9 4 (1.35%) Cisco
9 4 (1.35%) Citrix
9 4 (1.35%) MuleSoft
9 4 (1.35%) Okta
9 4 (1.35%) Splunk
9 4 (1.35%) Starlink