Continuous Improvement Contracts in Bristol

Continual Improvement
South West > Bristol

The table below provides summary statistics for contract job vacancies advertised in Bristol requiring Continuous Improvement skills. It includes a benchmarking guide to the contractor rates offered in vacancies that cited Continuous Improvement over the 6 months leading up to 20 September 2024, comparing them to the same period in the previous two years.

6 months to
20 Sep 2024
Same period 2023 Same period 2022
Rank 36 40 70
Rank change year-on-year +4 +30 -3
Contract jobs citing Continuous Improvement 45 42 33
As % of all contract jobs advertised in Bristol 4.92% 3.89% 2.41%
As % of the Processes & Methodologies category 5.93% 4.48% 2.67%
Number of daily rates quoted 31 31 20
10th Percentile £140 £369 £313
25th Percentile £221 £466 £343
Median daily rate (50th Percentile) £450 £650 £488
Median % change year-on-year -30.77% +33.33% +2.63%
75th Percentile £569 £700 £575
90th Percentile £613 £790 £665
South West median daily rate £500 £650 £575
% change year-on-year -23.08% +13.04% +15.00%
Number of hourly rates quoted 1 6 2
10th Percentile - £25.45 -
25th Percentile - £35.00 £81.25
Median hourly rate £35.00 £50.00 £82.50
Median % change year-on-year -30.00% -39.39% +175.00%
75th Percentile - £65.00 £83.75
90th Percentile - - -
South West median hourly rate £35.00 £35.00 £82.50
% change year-on-year - -57.58% +121.18%

All Process and Methodology Skills
Bristol

Continuous Improvement falls under the Processes and Methodologies category. For comparison with the information above, the following table provides summary statistics for all contract job vacancies requiring process or methodology skills in Bristol.

Contract vacancies with a requirement for process or methodology skills 759 938 1,237
As % of all contract IT jobs advertised in Bristol 82.95% 86.77% 90.29%
Number of daily rates quoted 407 636 842
10th Percentile £300 £308 £310
25th Percentile £413 £413 £413
Median daily rate (50th Percentile) £500 £525 £500
Median % change year-on-year -4.76% +5.00% +11.11%
75th Percentile £599 £650 £600
90th Percentile £703 £725 £675
South West median daily rate £525 £550 £525
% change year-on-year -4.55% +4.76% +12.90%
Number of hourly rates quoted 140 117 154
10th Percentile £49.80 £23.70 £35.00
25th Percentile £65.00 £50.00 £47.50
Median hourly rate £70.00 £65.00 £65.00
Median % change year-on-year +7.69% - +64.56%
75th Percentile £72.50 £76.25 £65.75
90th Percentile £77.75 £83.40 £75.00
South West median hourly rate £67.50 £65.00 £59.84
% change year-on-year +3.85% +8.62% +32.58%

Continuous Improvement
Job Vacancy Trend in Bristol

Job postings citing Continuous Improvement as a proportion of all IT jobs advertised in Bristol.
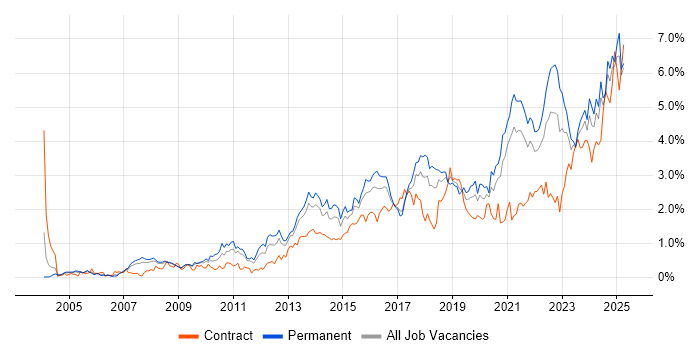
Job vacancy trend for Continuous Improvement in Bristol

Continuous Improvement
Contractor Daily Rate Trend in Bristol

3-month moving average daily rate quoted in jobs citing Continuous Improvement in Bristol.

Daily rate trend for Continuous Improvement in Bristol

Continuous Improvement
Daily Rate Histogram in Bristol

Daily rate distribution for jobs citing Continuous Improvement in Bristol over the 6 months to 20 September 2024.

Daily rate histogram for Continuous Improvement in Bristol

Continuous Improvement
Contractor Hourly Rate Trend in Bristol

3-month moving average hourly rates quoted in jobs citing Continuous Improvement in Bristol.

Hourly rate trend for Continuous Improvement in Bristol

Continuous Improvement
Co-occurring Skills and Capabilities in Bristol by Category

The follow tables expand on the table above by listing co-occurrences grouped by category. The same employment type, locality and period is covered with up to 20 co-occurrences shown in each of the following categories:

Application Platforms
1 1 (2.22%) Apache Airflow
Applications
1 5 (11.11%) Microsoft Office
2 2 (4.44%) Microsoft Excel
3 1 (2.22%) Microsoft PowerPoint
3 1 (2.22%) MS Visio
Business Applications
1 6 (13.33%) Remedy ITSM
2 2 (4.44%) Elite 3E
Cloud Services
1 11 (24.44%) Azure
2 9 (20.00%) Microsoft 365
3 6 (13.33%) Entra ID
4 5 (11.11%) Power Platform
5 4 (8.89%) AWS
6 2 (4.44%) OneDrive
7 1 (2.22%) Amazon S3
7 1 (2.22%) AWS Lambda
7 1 (2.22%) PowerApps
7 1 (2.22%) Serverless
Communications & Networking
1 2 (4.44%) DHCP
1 2 (4.44%) DNS
1 2 (4.44%) VPN
Database & Business Intelligence
1 4 (8.89%) Power BI
2 1 (2.22%) Amazon Redshift
2 1 (2.22%) Big Data
2 1 (2.22%) Data Warehouse
2 1 (2.22%) Metadata
2 1 (2.22%) Oracle Reports
2 1 (2.22%) Relational Database
2 1 (2.22%) SQL Server
2 1 (2.22%) Tableau
Development Applications
1 2 (4.44%) MSI
2 1 (2.22%) Git
2 1 (2.22%) JIRA
General
1 17 (37.78%) Social Skills
2 11 (24.44%) Finance
3 10 (22.22%) Public Sector
4 9 (20.00%) Telecoms
5 8 (17.78%) Analytical Skills
6 4 (8.89%) Legal
7 3 (6.67%) Electronics
7 3 (6.67%) Manufacturing
7 3 (6.67%) Marketing
8 2 (4.44%) Banking
9 1 (2.22%) Aviation
9 1 (2.22%) Documentation Skills
9 1 (2.22%) General Ledger
9 1 (2.22%) Local Government
9 1 (2.22%) Military
9 1 (2.22%) Organisational Skills
9 1 (2.22%) Police
9 1 (2.22%) Retail
9 1 (2.22%) Retail Banking
Job Titles
1 11 (24.44%) Lead
2 10 (22.22%) Analyst
3 6 (13.33%) Project Manager
3 6 (13.33%) Service Analyst
3 6 (13.33%) Service Desk Analyst
4 4 (8.89%) 1st Line Service Desk Analyst
4 4 (8.89%) Technical Leader
5 3 (6.67%) Development Manager
5 3 (6.67%) IT Manager
5 3 (6.67%) IT Services Manager
5 3 (6.67%) ITSM Specialist
5 3 (6.67%) Service Management Specialist
5 3 (6.67%) Service Manager
5 3 (6.67%) Software Development Manager
5 3 (6.67%) Software Manager
6 2 (4.44%) 2nd Line Support
6 2 (4.44%) Coordinator
6 2 (4.44%) Senior Manager
6 2 (4.44%) Support Engineer
6 2 (4.44%) Technical Project Manager
Libraries, Frameworks & Software Standards
1 2 (4.44%) Software Packaging
Miscellaneous
1 6 (13.33%) Management Information System
2 3 (6.67%) Mobile App
3 2 (4.44%) IoT
3 2 (4.44%) Product Ownership
3 2 (4.44%) Renewable Energy
3 2 (4.44%) SCADA
3 2 (4.44%) Video Conferencing
4 1 (2.22%) CSOC
4 1 (2.22%) Cyber Defence
4 1 (2.22%) Cyber Threat
4 1 (2.22%) Cyberattack
4 1 (2.22%) Low-Code
4 1 (2.22%) Security Operations Centre
4 1 (2.22%) Team-Oriented Environment
Operating Systems
1 8 (17.78%) Windows
2 4 (8.89%) Windows 10
Processes & Methodologies
1 19 (42.22%) Problem-Solving
2 18 (40.00%) ITIL
3 17 (37.78%) Agile
4 10 (22.22%) ITSM
4 10 (22.22%) Project Delivery
4 10 (22.22%) Service Delivery
4 10 (22.22%) Service Management
5 8 (17.78%) Project Management
6 7 (15.56%) Root Cause Analysis
7 6 (13.33%) Business Intelligence
7 6 (13.33%) Enterprise Architecture
7 6 (13.33%) Incident Management
7 6 (13.33%) Waterfall
8 5 (11.11%) Customer Service
8 5 (11.11%) Programme Management
8 5 (11.11%) Roadmaps
8 5 (11.11%) Technical Leadership
8 5 (11.11%) Time Management
9 4 (8.89%) Decision-Making
9 4 (8.89%) Product Roadmap
Programming Languages
1 5 (11.11%) SQL
2 3 (6.67%) Python
3 2 (4.44%) PowerShell
4 1 (2.22%) PL/SQL
4 1 (2.22%) TypeScript
Qualifications
1 14 (31.11%) Security Cleared
2 12 (26.67%) SC Cleared
3 6 (13.33%) Degree
4 4 (8.89%) A+ Certification
5 3 (6.67%) Computer Science Degree
6 2 (4.44%) ITIL Foundation Certificate
7 1 (2.22%) BPSS Clearance
7 1 (2.22%) DV Cleared
7 1 (2.22%) Master's Degree
7 1 (2.22%) PRINCE2 Practitioner
Quality Assurance & Compliance
1 2 (4.44%) GDPR
1 2 (4.44%) PMO
2 1 (2.22%) APQC
2 1 (2.22%) Data Quality
2 1 (2.22%) ISO 9001
2 1 (2.22%) QA
2 1 (2.22%) SLA
System Software
1 12 (26.67%) Active Directory
2 6 (13.33%) Virtual Machines
3 2 (4.44%) Hyper-V
3 2 (4.44%) Microsoft App-V
3 2 (4.44%) Virtual Desktop
3 2 (4.44%) VMware Infrastructure
Systems Management
1 2 (4.44%) Jamf Pro
1 2 (4.44%) SCCM
Vendors
1 12 (26.67%) Microsoft
2 6 (13.33%) BMC
2 6 (13.33%) Remedy
3 3 (6.67%) SAP
4 2 (4.44%) Citrix
4 2 (4.44%) Dell
4 2 (4.44%) Fortinet
4 2 (4.44%) iManage
4 2 (4.44%) Intapp
4 2 (4.44%) VMware
5 1 (2.22%) Databricks
5 1 (2.22%) Oracle
5 1 (2.22%) SnapLogic
5 1 (2.22%) Talend