REST Contract Job Trends in the East Midlands

Representational State Transfer (REST)
England > East Midlands

The table below provides summary statistics and contractor rates for jobs advertised in the East Midlands requiring REST skills. It covers contract job vacancies from the 6 months leading up to 4 November 2025, with comparisons to the same periods in the previous two years.

6 months to
4 Nov 2025
Same period 2024 Same period 2023
Rank 38 52 59
Rank change year-on-year +14 +7 +28
Contract jobs citing REST 40 10 10
As % of all contract jobs in the East Midlands 4.67% 1.37% 1.24%
As % of the Libraries, Frameworks & Software Standards category 18.96% 7.81% 6.67%
Number of daily rates quoted 36 9 10
10th Percentile £274 £347 £467
25th Percentile £356 £356 £550
Median daily rate (50th Percentile) £372 £425 £600
Median % change year-on-year -12.59% -29.17% +14.94%
75th Percentile £433 £510 £669
90th Percentile £450 £518 £713
England median daily rate £498 £532 £575
% change year-on-year -6.40% -7.57% -

All Software Libraries and Frameworks
East Midlands

REST falls under the Software Libraries and Frameworks category. For comparison with the information above, the following table provides summary statistics for all contract job vacancies requiring technical specification, industry standards, software libraries and framework skills in the East Midlands.

Contract vacancies with a requirement for technical specification, industry standards, software libraries and framework skills 211 128 150
As % of all contract IT jobs advertised in the East Midlands 24.62% 17.58% 18.61%
Number of daily rates quoted 176 98 125
10th Percentile £269 £309 £305
25th Percentile £359 £340 £381
Median daily rate (50th Percentile) £414 £442 £475
Median % change year-on-year -6.39% -6.95% -
75th Percentile £500 £510 £569
90th Percentile £625 £577 £650
England median daily rate £508 £550 £550
% change year-on-year -7.73% - -4.35%
Number of hourly rates quoted 3 0 3
10th Percentile £21.21 - £27.86
25th Percentile £22.64 - £38.41
Median hourly rate £25.08 - £56.00
Median % change year-on-year - - +184.77%
75th Percentile £25.13 - £60.50
90th Percentile £25.14 - £63.20
England median hourly rate £55.00 £65.00 £55.00
% change year-on-year -15.38% +18.18% -15.38%

REST
Job Vacancy Trend in the East Midlands

Historical trend showing the proportion of contract IT job postings citing REST relative to all contract IT jobs advertised in the East Midlands.
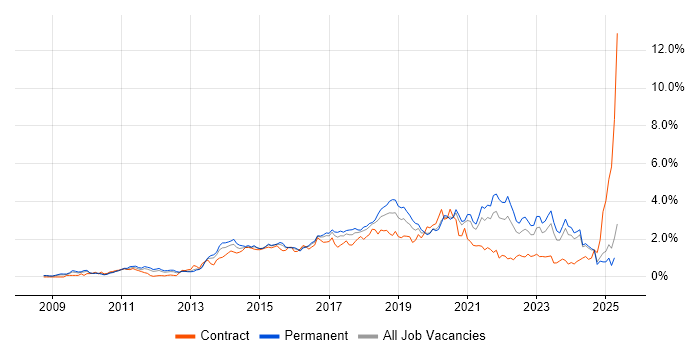
REST job vacancy trend in the East Midlands

REST
Daily Rate Trend in the East Midlands

Contractor daily rate distribution trend for jobs in the East Midlands citing REST.

Contractor daily rate distribution trend for jobs in the East Midlands citing REST

REST
Daily Rate Histogram in the East Midlands

Daily rate distribution for jobs citing REST in the East Midlands over the 6 months to 4 November 2025.

Daily rate histogram for REST in the East Midlands

REST
Contract Job Locations in the East Midlands

The table below looks at the demand and provides a guide to the median contractor rates quoted in IT jobs citing REST within the East Midlands region over the 6 months to 4 November 2025. The 'Rank Change' column provides an indication of the change in demand within each location based on the same 6 month period last year.

Location Rank Change
on Same Period
Last Year
Matching
Contract
IT Job Ads
Median
Daily Rate
Past 6 Months
Median Daily Rate
% Change
on Same Period
Last Year
Live
Jobs
Northamptonshire +17 36 £368 +3.37% 5
Nottinghamshire -6 2 £421 -14.08% 6
Derbyshire - 2 - - 4
REST
England

REST
Co-Occurring Skills & Capabilities in the East Midlands by Category

The following tables expand on the one above by listing co-occurrences grouped by category. They cover the same employment type, locality and period, with up to 20 co-occurrences shown in each category:

Application Platforms
1 3 (7.50%) Oracle Application Server
2 2 (5.00%) JBoss
2 2 (5.00%) Mule
2 2 (5.00%) Tomcat
3 1 (2.50%) Apache Spark
3 1 (2.50%) Confluence
3 1 (2.50%) SharePoint
3 1 (2.50%) WebLogic
3 1 (2.50%) WebSphere
Applications
1 2 (5.00%) Microsoft Office
Business Applications
1 2 (5.00%) Teamcenter
2 1 (2.50%) NetSuite
Cloud Services
1 13 (32.50%) AWS
2 9 (22.50%) Azure
3 8 (20.00%) Salesforce Sales Cloud
3 8 (20.00%) Salesforce Service Cloud
4 5 (12.50%) GCP
5 3 (7.50%) Amazon CloudWatch
5 3 (7.50%) Amazon S3
5 3 (7.50%) AWS Lambda
5 3 (7.50%) Serverless
6 2 (5.00%) Amazon Bedrock
6 2 (5.00%) Amazon EKS
6 2 (5.00%) Amazon OpenSearch
6 2 (5.00%) Anthropic Claude
6 2 (5.00%) AWS Step Functions
7 1 (2.50%) AtomSphere
7 1 (2.50%) AWS CodeBuild
7 1 (2.50%) Boomi
7 1 (2.50%) Power Automate
7 1 (2.50%) Power Platform
7 1 (2.50%) PowerApps
Communications & Networking
1 6 (15.00%) HTTP
2 3 (7.50%) HTTPS
2 3 (7.50%) SSL
Database & Business Intelligence
1 3 (7.50%) DynamoDB
1 3 (7.50%) MongoDB
1 3 (7.50%) NoSQL
1 3 (7.50%) Oracle Database
2 2 (5.00%) Amazon RDS
2 2 (5.00%) MariaDB
3 1 (2.50%) Apache Hive
3 1 (2.50%) Big Data
3 1 (2.50%) Data Warehouse
3 1 (2.50%) DB2
3 1 (2.50%) Hadoop
3 1 (2.50%) Metadata
3 1 (2.50%) SQL Server
Development Applications
1 12 (30.00%) Git
2 5 (12.50%) Jenkins
3 4 (10.00%) Bitbucket Server
3 4 (10.00%) Cucumber
3 4 (10.00%) Selenium
4 3 (7.50%) Bitbucket
4 3 (7.50%) LoadRunner
4 3 (7.50%) REST Assured
5 2 (5.00%) Jasmine
5 2 (5.00%) JIRA
5 2 (5.00%) Karma Test Runner
5 2 (5.00%) Mocha
5 2 (5.00%) Protractor
5 2 (5.00%) SonarQube
5 2 (5.00%) Subversion
6 1 (2.50%) Cypress.io
6 1 (2.50%) Gradle
6 1 (2.50%) JUnit
6 1 (2.50%) Maven
6 1 (2.50%) Postman
General
1 11 (27.50%) Social Skills
2 8 (20.00%) Marketing
3 5 (12.50%) Finance
4 4 (10.00%) Analytical Skills
4 4 (10.00%) Banking
5 3 (7.50%) Public Sector
6 2 (5.00%) Aerospace
Job Titles
1 14 (35.00%) Developer
2 8 (20.00%) Architect
3 7 (17.50%) Java Developer
3 7 (17.50%) Salesforce Architect
4 5 (12.50%) Analyst
5 4 (10.00%) Angular Developer
6 3 (7.50%) Business Analyst
6 3 (7.50%) Test Engineer
7 2 (5.00%) Artificial Intelligence Engineer
7 2 (5.00%) Automation Tester
7 2 (5.00%) Design Engineer
7 2 (5.00%) Digital Design Engineer
7 2 (5.00%) Gen AI Engineer
7 2 (5.00%) Performance Engineer
7 2 (5.00%) Performance Test Engineer
7 2 (5.00%) Test Analyst
7 2 (5.00%) Tester
8 1 (2.50%) AWS Developer
8 1 (2.50%) Front-End Engineer (Client-Side Engineer)
8 1 (2.50%) Lead
Libraries, Frameworks & Software Standards
1 12 (30.00%) SOAP
2 9 (22.50%) Middleware
3 8 (20.00%) Lightning Web Components
3 8 (20.00%) Spring
3 8 (20.00%) Visualforce
4 7 (17.50%) AngularJS
4 7 (17.50%) CSS
4 7 (17.50%) HTML
5 6 (15.00%) RAML
5 6 (15.00%) Spring Boot
6 5 (12.50%) jQuery
6 5 (12.50%) React
6 5 (12.50%) RESTful
6 5 (12.50%) Spring Batch
6 5 (12.50%) Web Services
7 4 (10.00%) HTML5
7 4 (10.00%) Kafka
7 4 (10.00%) LDAP
8 3 (7.50%) Lambda Expressions
8 3 (7.50%) Spring Cloud
Miscellaneous
1 7 (17.50%) Product Ownership
2 4 (10.00%) Management Information System
3 3 (7.50%) State Machine
4 1 (2.50%) Data Structures
4 1 (2.50%) Private Cloud
Operating Systems
1 2 (5.00%) Linux
1 2 (5.00%) Unix
Processes & Methodologies
1 18 (45.00%) Problem-Solving
2 17 (42.50%) Agile
3 14 (35.00%) Design Patterns
4 11 (27.50%) Integration Patterns
5 10 (25.00%) CI/CD
5 10 (25.00%) Microservices
6 9 (22.50%) Data Governance
6 9 (22.50%) Data Modelling
6 9 (22.50%) Migration
7 8 (20.00%) Architecture Roadmap
7 8 (20.00%) Data Flow Diagram
7 8 (20.00%) Data Migration
7 8 (20.00%) Data Security
7 8 (20.00%) Roadmaps
7 8 (20.00%) Technical Leadership
8 7 (17.50%) Data Management
8 7 (17.50%) DevOps
8 7 (17.50%) Mentoring
8 7 (17.50%) Scrum
8 7 (17.50%) SDLC
Programming Languages
1 17 (42.50%) SQL
2 14 (35.00%) Java
3 8 (20.00%) Apex Code
4 6 (15.00%) JavaScript
4 6 (15.00%) Python
5 5 (12.50%) TypeScript
6 3 (7.50%) PL/SQL
7 2 (5.00%) C
7 2 (5.00%) C#
7 2 (5.00%) C++
7 2 (5.00%) Shell Script
Qualifications
1 7 (17.50%) Degree
2 5 (12.50%) Computer Science Degree
2 5 (12.50%) Master's Degree
3 3 (7.50%) Security Cleared
4 1 (2.50%) BPSS Clearance
Quality Assurance & Compliance
1 8 (20.00%) California Consumer Privacy Act
1 8 (20.00%) Data Quality
1 8 (20.00%) GDPR
2 5 (12.50%) QA
System Software
1 4 (10.00%) Active Directory
2 3 (7.50%) Docker
Systems Management
1 3 (7.50%) Kibana
1 3 (7.50%) Kubernetes
Vendors
1 9 (22.50%) Salesforce
2 6 (15.00%) Microsoft
2 6 (15.00%) Oracle
3 3 (7.50%) AppDynamics
3 3 (7.50%) Dynatrace
3 3 (7.50%) Google
3 3 (7.50%) New Relic
3 3 (7.50%) Splunk
4 2 (5.00%) Checkmarx
4 2 (5.00%) Siemens
5 1 (2.50%) Ab Initio
5 1 (2.50%) Adobe
5 1 (2.50%) Dell
5 1 (2.50%) SAP
5 1 (2.50%) Solace
5 1 (2.50%) Workday