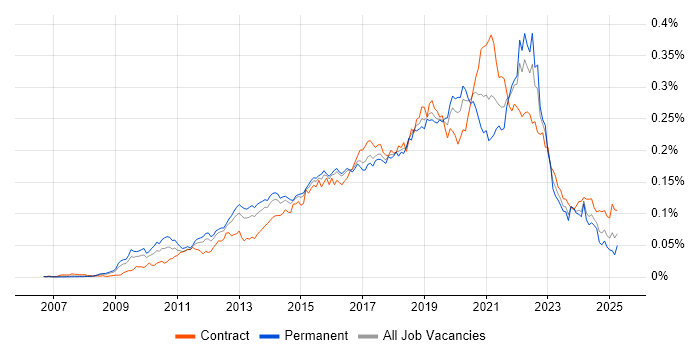
User Interface/User Experience Designer
UK > England
The median User Interface/User Experience Designer daily rate in England is £480, according to job vacancies posted in the 6 months leading up to 1 May 2025.
The table below provides contractor rate benchmarking and summary statistics, comparing them to the same period in the previous two years.
| 6 months to 1 May 2025 |
Same period 2024 | Same period 2023 | |
|---|---|---|---|
| Rank | 459 | 489 | 554 |
| Rank change year-on-year | +30 | +65 | +43 |
| Contract jobs requiring a UI/UX Designer | 26 | 53 | 99 |
| As % of all contract jobs advertised in England | 0.11% | 0.14% | 0.20% |
| As % of the Job Titles category | 0.12% | 0.15% | 0.21% |
| Number of daily rates quoted | 22 | 30 | 76 |
| 10th Percentile | £325 | £350 | £263 |
| 25th Percentile | £363 | £400 | £417 |
| Median daily rate (50th Percentile) | £480 | £481 | £543 |
| Median % change year-on-year | -0.26% | -11.29% | +10.71% |
| 75th Percentile | £575 | £573 | £750 |
| 90th Percentile | £825 | £604 | £838 |
| UK median daily rate | £438 | £469 | £550 |
| % change year-on-year | -6.67% | -14.77% | +12.24% |
All Contract IT Job Vacancies
England
For comparison with the information above, the following table provides summary statistics for all contract IT job vacancies in England. Most job vacancies include a discernible job title that can be normalized. As such, the figures in the second row provide an indication of the number of contract jobs in our overall sample.
| Contract vacancies in England with a recognized job title | 22,549 | 34,488 | 47,741 |
| % of contract IT jobs with a recognized job title | 92.59% | 92.73% | 94.62% |
| Number of daily rates quoted | 15,007 | 22,894 | 33,903 |
| 10th Percentile | £300 | £275 | £313 |
| 25th Percentile | £409 | £413 | £425 |
| Median daily rate (50th Percentile) | £525 | £525 | £550 |
| Median % change year-on-year | - | -4.55% | +4.76% |
| 75th Percentile | £638 | £643 | £663 |
| 90th Percentile | £750 | £750 | £763 |
| UK median daily rate | £515 | £525 | £540 |
| % change year-on-year | -1.90% | -2.78% | +2.86% |
| Number of hourly rates quoted | 900 | 2,432 | 1,409 |
| 10th Percentile | £14.20 | £13.00 | £14.35 |
| 25th Percentile | £18.51 | £16.30 | £20.00 |
| Median hourly rate | £30.62 | £36.31 | £45.00 |
| Median % change year-on-year | -15.67% | -19.32% | +100.00% |
| 75th Percentile | £63.75 | £61.25 | £65.00 |
| 90th Percentile | £75.00 | £72.50 | £76.60 |
| UK median hourly rate | £29.00 | £36.42 | £45.00 |
| % change year-on-year | -20.37% | -19.07% | +91.49% |
UI/UX Designer
Job Vacancy Trend in England
Job postings that featured UI/UX Designer in the job title as a proportion of all IT jobs advertised in England.

UI/UX Designer
Contractor Daily Rate Trend in England
3-month moving average daily rate quoted in jobs citing UI/UX Designer in England.
UI/UX Designer
Daily Rate Histogram in England
Daily rate distribution for jobs citing UI/UX Designer in England over the 6 months to 1 May 2025.
UI/UX Designer
Contractor Hourly Rate Trend in England
3-month moving average hourly rates quoted in jobs citing UI/UX Designer in England.
UI/UX Designer
Contract Job Locations in England
The table below looks at the demand and provides a guide to the median contractor rates quoted in IT jobs citing UI/UX Designer within the England region over the 6 months to 1 May 2025. The 'Rank Change' column provides an indication of the change in demand within each location based on the same 6 month period last year.
| Location | Rank Change on Same Period Last Year |
Matching Contract IT Job Ads |
Median Daily Rate Past 6 Months |
Median Daily Rate % Change on Same Period Last Year |
Live Jobs |
|---|---|---|---|---|---|
| London | +23 | 16 | £550 | +7.32% | 24 |
| South West | +47 | 4 | £375 | -11.76% | 6 |
| Midlands | +22 | 2 | £318 | -24.04% | |
| North of England | +17 | 2 | £339 | -26.70% | 5 |
| East Midlands | +10 | 2 | £318 | -24.04% | |
| South East | +39 | 1 | £550 | +15.79% | 6 |
| North West | +16 | 1 | £313 | - | 3 |
| Yorkshire | +7 | 1 | £365 | -21.08% | 2 |
| East of England | - | 1 | £480 | - | |
| UI/UX Designer UK |
|||||
UI/UX Designer Skill Set
Top 30 Co-occurring Skills and Capabilities in England
For the 6 months to 1 May 2025, UI/UX Designer contract job roles required the following skills and capabilities in order of popularity. The figures indicate the absolute number co-occurrences and as a proportion of all contract job ads across the England region featuring UI/UX Designer in the job title.
|
|
UI/UX Designer Skill Set
Co-occurring Skills and Capabilities in England by Category
The follow tables expand on the table above by listing co-occurrences grouped by category. The same employment type, locality and period is covered with up to 20 co-occurrences shown in each of the following categories:
