Migration Contracts in the North of England

Migration
England > North of England

The table below provides summary statistics for contract job vacancies advertised in the North of England requiring Migration skills. It includes a benchmarking guide to the contractor rates offered in vacancies that cited Migration over the 6 months leading up to 11 August 2025, comparing them to the same period in the previous two years.

6 months to
11 Aug 2025
Same period 2024 Same period 2023
Rank 17 21 16
Rank change year-on-year +4 -5 +7
Contract jobs citing Migration 374 286 399
As % of all contract jobs advertised in the North of England 9.42% 6.94% 7.53%
As % of the Processes & Methodologies category 10.57% 8.27% 8.47%
Number of daily rates quoted 232 197 310
10th Percentile £346 £350 £350
25th Percentile £400 £425 £418
Median daily rate (50th Percentile) £475 £500 £500
Median % change year-on-year -5.00% -0.04% +5.31%
75th Percentile £575 £588 £600
90th Percentile £670 £638 £676
England median daily rate £518 £535 £550
% change year-on-year -3.14% -2.73% +4.76%
Number of hourly rates quoted 28 3 3
10th Percentile £23.91 £51.65 -
25th Percentile - £56.00 -
Median hourly rate £25.15 £66.50 £70.00
Median % change year-on-year -62.18% -5.00% +255.15%
75th Percentile £30.63 £86.88 -
90th Percentile £71.88 £97.15 -
England median hourly rate £25.15 £67.50 £69.25
% change year-on-year -62.74% -2.53% +75.32%

All Process and Methodology Skills
North of England

Migration falls under the Processes and Methodologies category. For comparison with the information above, the following table provides summary statistics for all contract job vacancies requiring process or methodology skills in the North of England.

Contract vacancies with a requirement for process or methodology skills 3,538 3,459 4,711
As % of all contract IT jobs advertised in the North of England 89.07% 83.90% 88.87%
Number of daily rates quoted 2,251 2,078 3,154
10th Percentile £268 £310 £285
25th Percentile £375 £406 £413
Median daily rate (50th Percentile) £469 £500 £500
Median % change year-on-year -6.20% - -
75th Percentile £556 £586 £600
90th Percentile £650 £675 £688
England median daily rate £513 £525 £550
% change year-on-year -2.38% -4.55% -
Number of hourly rates quoted 208 238 211
10th Percentile £12.82 £11.07 £15.75
25th Percentile £17.48 £14.39 £18.13
Median hourly rate £22.63 £25.30 £29.30
Median % change year-on-year -10.55% -13.65% +46.50%
75th Percentile £44.26 £48.75 £46.18
90th Percentile £73.75 £70.00 £59.25
England median hourly rate £25.15 £43.00 £41.00
% change year-on-year -41.51% +4.88% +54.72%

Migration
Job Vacancy Trend in the North of England

Job postings citing Migration as a proportion of all IT jobs advertised in the North of England.
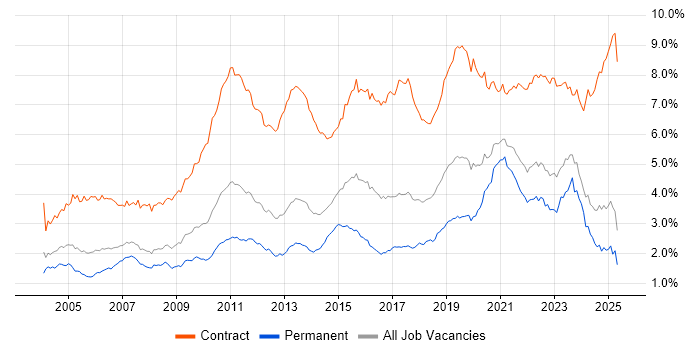
Job vacancy trend for Migration in the North of England

Migration
Contractor Daily Rate Trend in the North of England

3-month moving average daily rate quoted in jobs citing Migration in the North of England.

Daily rate trend for Migration in the North of England

Migration
Daily Rate Histogram in the North of England

Daily rate distribution for jobs citing Migration in the North of England over the 6 months to 11 August 2025.

Daily rate histogram for Migration in the North of England

Migration
Contractor Hourly Rate Trend in the North of England

3-month moving average hourly rates quoted in jobs citing Migration in the North of England.

Hourly rate trend for Migration in the North of England

Migration
Hourly Rate Histogram in the North of England

Hourly rate distribution of jobs citing Migration in the North of England over the 6 months to 11 August 2025.

Hourly rate histogram for Migration in the North of England

Migration
Contract Job Locations in the North of England

The table below looks at the demand and provides a guide to the median contractor rates quoted in IT jobs citing Migration within the North of England region over the 6 months to 11 August 2025. The 'Rank Change' column provides an indication of the change in demand within each location based on the same 6 month period last year.

Location Rank Change
on Same Period
Last Year
Matching
Contract
IT Job Ads
Median
Daily Rate
Past 6 Months
Median Daily Rate
% Change
on Same Period
Last Year
Live
Jobs
North West +4 197 £475 -5.00% 104
Yorkshire +8 164 £480 -6.34% 76
North East -5 20 £541 -4.84% 23
Migration
England

Migration
Co-occurring Skills and Capabilities in the North of England by Category

The follow tables expand on the table above by listing co-occurrences grouped by category. The same employment type, locality and period is covered with up to 20 co-occurrences shown in each of the following categories:

Application Platforms
1 29 (7.75%) Confluence
2 7 (1.87%) JBoss
3 5 (1.34%) CICS
3 5 (1.34%) SharePoint
4 3 (0.80%) Oracle SOA Suite
4 3 (0.80%) WebSphere
5 2 (0.53%) Microsoft Exchange
5 2 (0.53%) SharePoint Server
6 1 (0.27%) IBM Domino
6 1 (0.27%) Oracle Workflow
6 1 (0.27%) SAS
6 1 (0.27%) WebSphere Application Server
Applications
1 11 (2.94%) Microsoft Excel
2 4 (1.07%) Microsoft PowerPoint
2 4 (1.07%) MS Visio
3 2 (0.53%) Microsoft Office
4 1 (0.27%) SPSS
4 1 (0.27%) Stata
Business Applications
1 13 (3.48%) SAP S/4HANA
2 12 (3.21%) Oracle EBS
3 7 (1.87%) SAP PP
4 6 (1.60%) Dynamics CRM
5 4 (1.07%) SAP SD
6 2 (0.53%) NetSuite
6 2 (0.53%) Payment Gateway
6 2 (0.53%) Sage CRM
6 2 (0.53%) SAP HR
6 2 (0.53%) SAP MM
7 1 (0.27%) Distributed Ledger
7 1 (0.27%) Elite 3E
7 1 (0.27%) MIS ActiveH
7 1 (0.27%) Oracle Payroll
7 1 (0.27%) Oracle Subledger Accounting
7 1 (0.27%) Remedy ITSM
7 1 (0.27%) SAP QM
7 1 (0.27%) Veritas eDiscovery
Cloud Services
1 45 (12.03%) AWS
2 33 (8.82%) Azure
3 19 (5.08%) OpenShift
4 15 (4.01%) Microsoft 365
5 12 (3.21%) Power Platform
6 8 (2.14%) GitHub
7 7 (1.87%) SaaS
8 6 (1.60%) Dynamics 365
9 5 (1.34%) Entra ID
9 5 (1.34%) GCP
9 5 (1.34%) IaaS
9 5 (1.34%) Serverless
9 5 (1.34%) Snowflake
10 4 (1.07%) Amazon S3
10 4 (1.07%) Azure DevOps
11 3 (0.80%) AWS Lambda
11 3 (0.80%) Azure Logic Apps
11 3 (0.80%) Azure Monitor
11 3 (0.80%) PowerApps
11 3 (0.80%) ShareGate
Communications & Networking
1 29 (7.75%) Firewall
2 12 (3.21%) DNS
3 8 (2.14%) NAS
3 8 (2.14%) SAN
4 3 (0.80%) Cisco ASA
4 3 (0.80%) Kerberos
4 3 (0.80%) TCP/IP
5 2 (0.53%) Broadband
5 2 (0.53%) Intranet
5 2 (0.53%) SSL
5 2 (0.53%) Wi-Fi
5 2 (0.53%) Wireless
6 1 (0.27%) ATM
6 1 (0.27%) Internet
6 1 (0.27%) IPsec
6 1 (0.27%) MPLS
6 1 (0.27%) SMS
6 1 (0.27%) VPN
6 1 (0.27%) WAN
6 1 (0.27%) X.25
Database & Business Intelligence
1 18 (4.81%) Relational Database
2 17 (4.55%) Oracle Database
2 17 (4.55%) PostgreSQL
3 11 (2.94%) Oracle Reports
3 11 (2.94%) SQL Server
4 10 (2.67%) Power BI
5 9 (2.41%) Data Warehouse
6 8 (2.14%) RDBMS
6 8 (2.14%) Siebel EIM
7 7 (1.87%) Elasticsearch
8 6 (1.60%) SQL Server Integration Services
9 4 (1.07%) DB2
9 4 (1.07%) SAP HANA
9 4 (1.07%) Tableau
10 3 (0.80%) Amazon Redshift
10 3 (0.80%) BigQuery
11 2 (0.53%) Azure SQL Database
11 2 (0.53%) Easytrieve
11 2 (0.53%) Hadoop
11 2 (0.53%) IMS/DB
Development Applications
1 44 (11.76%) Jenkins
2 41 (10.96%) JIRA
3 27 (7.22%) Git
4 18 (4.81%) GitLab
5 15 (4.01%) JUnit
6 10 (2.67%) Gradle
6 10 (2.67%) Liquibase
6 10 (2.67%) Mockito
7 7 (1.87%) Bitbucket Server
7 7 (1.87%) CA Release Automation
7 7 (1.87%) SonarQube
7 7 (1.87%) Sonatype Nexus
7 7 (1.87%) TeamCity
8 5 (1.34%) Cucumber
8 5 (1.34%) ScriptRunner
9 4 (1.07%) Postman
9 4 (1.07%) Selenium
10 2 (0.53%) SOAtest
11 1 (0.27%) Bitbucket
11 1 (0.27%) SpecFlow
General
1 117 (31.28%) Finance
2 115 (30.75%) Social Skills
3 51 (13.64%) Analytical Skills
4 42 (11.23%) Banking
5 35 (9.36%) Public Sector
6 22 (5.88%) Documentation Skills
7 21 (5.61%) Manufacturing
8 17 (4.55%) Legal
9 12 (3.21%) Telecoms
10 10 (2.67%) Electronics
10 10 (2.67%) Marketing
10 10 (2.67%) Retail
11 8 (2.14%) French Language
11 8 (2.14%) Organisational Skills
11 8 (2.14%) Pharmaceutical
12 6 (1.60%) Local Government
13 3 (0.80%) General Ledger
13 3 (0.80%) Inclusion and Diversity
13 3 (0.80%) Japanese Language
13 3 (0.80%) Retail Banking
Job Titles
1 41 (10.96%) Developer
2 36 (9.63%) Analyst
3 31 (8.29%) Architect
4 21 (5.61%) Business Analyst
4 21 (5.61%) Senior
5 20 (5.35%) Lead
6 18 (4.81%) Consultant
7 16 (4.28%) Project Manager
8 15 (4.01%) Migration Engineer
8 15 (4.01%) Solutions Architect
9 13 (3.48%) Data Engineer
9 13 (3.48%) Migration Manager
10 12 (3.21%) Infrastructure Engineer
11 11 (2.94%) Administrator
11 11 (2.94%) Firewall Engineer
12 10 (2.67%) Java Developer
12 10 (2.67%) SAP Consultant
13 9 (2.41%) Data Analyst
13 9 (2.41%) Network Engineer
13 9 (2.41%) Test Manager
Libraries, Frameworks & Software Standards
1 24 (6.42%) Kafka
2 22 (5.88%) Spring Boot
3 17 (4.55%) React
4 15 (4.01%) Spring
4 15 (4.01%) Web Services
5 11 (2.94%) REST
5 11 (2.94%) SOAP
6 10 (2.67%) OpenAPI
6 10 (2.67%) Swagger
7 9 (2.41%) JMS
7 9 (2.41%) Keycloak
8 8 (2.14%) Elastic Stack
8 8 (2.14%) Middleware
9 6 (1.60%) HTML
9 6 (1.60%) OAuth
9 6 (1.60%) RESTful
9 6 (1.60%) XML
10 5 (1.34%) AngularJS
10 5 (1.34%) CSS
10 5 (1.34%) LDAP
Miscellaneous
1 32 (8.56%) Legacy Systems
2 25 (6.68%) Data Centre
3 17 (4.55%) Management Information System
4 9 (2.41%) Cloud Native
4 9 (2.41%) Mainframe
4 9 (2.41%) Product Ownership
5 8 (2.14%) NHS
6 7 (1.87%) Data Protection Act
6 7 (1.87%) Hybrid Cloud
7 6 (1.60%) Data Structures
7 6 (1.60%) Enterprise Software
8 5 (1.34%) Onboarding
8 5 (1.34%) Robotics
8 5 (1.34%) Security Posture
8 5 (1.34%) VSAM
9 4 (1.07%) Linux Command Line
9 4 (1.07%) Replication
9 4 (1.07%) Virtual Team
10 3 (0.80%) Public Cloud
10 3 (0.80%) Reference Data
Operating Systems
1 42 (11.23%) Windows
2 36 (9.63%) Linux
3 16 (4.28%) Windows Server
4 11 (2.94%) Red Hat Enterprise Linux
5 7 (1.87%) Windows 10
6 4 (1.07%) Unix
7 3 (0.80%) Solaris
7 3 (0.80%) zOS
8 2 (0.53%) HPUX
8 2 (0.53%) MVS
8 2 (0.53%) OS/400
8 2 (0.53%) VMS
9 1 (0.27%) AIX
9 1 (0.27%) SUSE Linux Enterprise Server
Processes & Methodologies
1 117 (31.28%) Data Migration
2 81 (21.66%) Problem-Solving
3 79 (21.12%) Agile
4 45 (12.03%) Stakeholder Management
5 44 (11.76%) Change Management
5 44 (11.76%) CI/CD
6 43 (11.50%) DevOps
7 37 (9.89%) Validation
8 32 (8.56%) ETL
8 32 (8.56%) Microservices
9 31 (8.29%) User Acceptance Testing
10 30 (8.02%) Performance Tuning
11 29 (7.75%) Project Management
12 28 (7.49%) Data Modelling
13 26 (6.95%) Workflow
14 23 (6.15%) Requirements Gathering
15 22 (5.88%) Containerisation
16 21 (5.61%) Business Intelligence
16 21 (5.61%) Infrastructure Engineering
16 21 (5.61%) Scrum
Programming Languages
1 75 (20.05%) SQL
2 47 (12.57%) Python
3 32 (8.56%) Java
4 25 (6.68%) PowerShell
5 24 (6.42%) PL/SQL
6 21 (5.61%) Bash
7 10 (2.67%) TypeScript
8 9 (2.41%) Perl
9 7 (1.87%) JCL
10 6 (1.60%) Shell Script
11 5 (1.34%) COBOL
11 5 (1.34%) Groovy
11 5 (1.34%) JavaScript
12 4 (1.07%) Apex Code
13 3 (0.80%) Bicep
13 3 (0.80%) REXX
14 2 (0.53%) C#
14 2 (0.53%) C++
14 2 (0.53%) PL/1
14 2 (0.53%) T-SQL
Qualifications
1 73 (19.52%) Security Cleared
2 65 (17.38%) SC Cleared
3 15 (4.01%) Degree
4 10 (2.67%) BPSS Clearance
5 8 (2.14%) Computer Science Degree
6 7 (1.87%) Cisco Certification
7 3 (0.80%) Azure Certification
8 2 (0.53%) AWS Certification
8 2 (0.53%) AWS Certified Solutions Architect
9 1 (0.27%) (ISC)2 CCSP
9 1 (0.27%) ACCA
9 1 (0.27%) CCNP
9 1 (0.27%) CISSP
9 1 (0.27%) DBS Check
9 1 (0.27%) GIAC
9 1 (0.27%) IBM Certification
9 1 (0.27%) Master's Degree
9 1 (0.27%) Microsoft Certification
9 1 (0.27%) PRINCE2 Certification
9 1 (0.27%) Tableau Certification
Quality Assurance & Compliance
1 23 (6.15%) QA
2 15 (4.01%) Data Quality
3 4 (1.07%) ISO/IEC 27001
4 3 (0.80%) GDPR
4 3 (0.80%) PCI DSS
5 2 (0.53%) Actionable Recommendations
5 2 (0.53%) ISO 20022
5 2 (0.53%) ISO 8583
5 2 (0.53%) NIST
5 2 (0.53%) PSD2
5 2 (0.53%) SEPA
6 1 (0.27%) Accessibility
6 1 (0.27%) COBIT
6 1 (0.27%) PMO
6 1 (0.27%) SOC 1
6 1 (0.27%) WCAG
System Software
1 26 (6.95%) Active Directory
2 20 (5.35%) Docker
3 12 (3.21%) VMware Infrastructure
4 9 (2.41%) VMware NSX
5 8 (2.14%) Virtual Machines
6 7 (1.87%) vSphere
7 3 (0.80%) Time Sharing Option
8 2 (0.53%) Apache ZooKeeper
8 2 (0.53%) Microsoft App-V
8 2 (0.53%) Oracle RAC
8 2 (0.53%) PowerHA
8 2 (0.53%) Veritas Cluster Server
8 2 (0.53%) VMware ESXi
9 1 (0.27%) Firmware
9 1 (0.27%) XenApp
9 1 (0.27%) XenDesktop
Systems Management
1 33 (8.82%) Ansible
2 31 (8.29%) Kubernetes
3 18 (4.81%) Terraform
4 12 (3.21%) Oracle RMAN
5 11 (2.94%) Progress Chef
6 9 (2.41%) Istio
6 9 (2.41%) Single Sign-On
6 9 (2.41%) vCenter Server
7 8 (2.14%) Argo
8 7 (1.87%) Kibana
8 7 (1.87%) vRealize
9 3 (0.80%) Microsoft Intune
9 3 (0.80%) Prometheus
9 3 (0.80%) Puppet
10 2 (0.53%) CA Endevor
10 2 (0.53%) Data Guard
10 2 (0.53%) Grafana
10 2 (0.53%) Oracle Enterprise Manager
11 1 (0.27%) Microsoft Clustering
11 1 (0.27%) SCSM
Vendors
1 50 (13.37%) Oracle
2 49 (13.10%) Microsoft
3 48 (12.83%) SAP
4 20 (5.35%) Red Hat
5 17 (4.55%) VMware
6 13 (3.48%) CheckPoint
6 13 (3.48%) Cisco
7 10 (2.67%) Commvault
7 10 (2.67%) Splunk
8 9 (2.41%) IBM
9 8 (2.14%) Siebel
10 7 (1.87%) AppDynamics
10 7 (1.87%) Databricks
11 6 (1.60%) Atlassian
11 6 (1.60%) Cloudera
12 5 (1.34%) MuleSoft
12 5 (1.34%) ServiceNow
13 4 (1.07%) F5
13 4 (1.07%) Fortinet
13 4 (1.07%) SolarWinds