Migration Contracts in the North West

Migration
England > North West

The table below provides summary statistics for contract job vacancies advertised in the North West requiring Migration skills. It includes a benchmarking guide to the contractor rates offered in vacancies that cited Migration over the 6 months leading up to 30 April 2025, comparing them to the same period in the previous two years.

6 months to
30 Apr 2025
Same period 2024 Same period 2023
Rank 18 25 25
Rank change year-on-year +7 0 -1
Contract jobs citing Migration 179 170 209
As % of all contract jobs advertised in the North West 9.17% 6.12% 6.55%
As % of the Processes & Methodologies category 10.15% 7.10% 7.22%
Number of daily rates quoted 125 111 166
10th Percentile £363 £363 £363
25th Percentile £413 £450 £420
Median daily rate (50th Percentile) £525 £500 £500
Median % change year-on-year +5.00% - +11.11%
75th Percentile £600 £600 £600
90th Percentile £695 £650 £680
England median daily rate £537 £525 £550
% change year-on-year +2.29% -4.55% +4.76%
Number of hourly rates quoted 10 9 7
10th Percentile £16.23 - £50.00
25th Percentile £26.88 £15.50 -
Median hourly rate £28.75 £16.00 £70.00
Median % change year-on-year +79.69% -77.14% +11.11%
75th Percentile £31.30 £16.50 -
90th Percentile £70.63 £100.80 -
England median hourly rate £25.15 £43.12 £65.00
% change year-on-year -41.67% -33.67% +142.99%

All Process and Methodology Skills
North West

Migration falls under the Processes and Methodologies category. For comparison with the information above, the following table provides summary statistics for all contract job vacancies requiring process or methodology skills in the North West.

Contract vacancies with a requirement for process or methodology skills 1,763 2,396 2,893
As % of all contract IT jobs advertised in the North West 90.32% 86.28% 90.60%
Number of daily rates quoted 1,141 1,533 2,057
10th Percentile £300 £306 £313
25th Percentile £393 £401 £413
Median daily rate (50th Percentile) £475 £500 £500
Median % change year-on-year -5.00% - +5.26%
75th Percentile £575 £590 £588
90th Percentile £662 £688 £675
England median daily rate £525 £525 £550
% change year-on-year - -4.55% +2.33%
Number of hourly rates quoted 106 244 144
10th Percentile £16.16 £10.95 £16.85
25th Percentile £22.78 £13.30 £21.25
Median hourly rate £32.25 £21.00 £35.00
Median % change year-on-year +53.57% -40.00% +70.82%
75th Percentile £60.00 £45.22 £48.91
90th Percentile £84.33 £57.50 £65.00
England median hourly rate £30.00 £35.83 £37.50
% change year-on-year -16.27% -4.45% +53.20%

Migration
Job Vacancy Trend in the North West

Job postings citing Migration as a proportion of all IT jobs advertised in the North West.
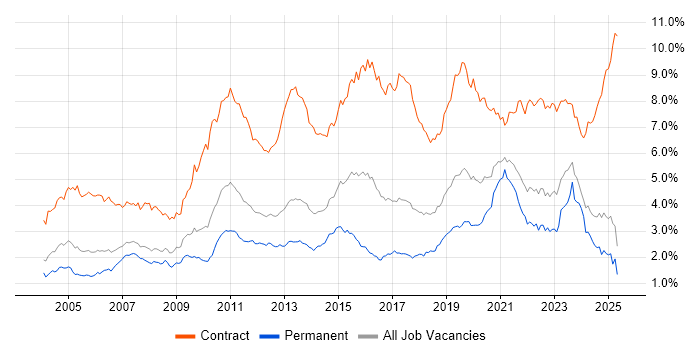
Job vacancy trend for Migration in the North West

Migration
Contractor Daily Rate Trend in the North West

3-month moving average daily rate quoted in jobs citing Migration in the North West.

Daily rate trend for Migration in the North West

Migration
Daily Rate Histogram in the North West

Daily rate distribution for jobs citing Migration in the North West over the 6 months to 30 April 2025.

Daily rate histogram for Migration in the North West

Migration
Contractor Hourly Rate Trend in the North West

3-month moving average hourly rates quoted in jobs citing Migration in the North West.

Hourly rate trend for Migration in the North West

Migration
Hourly Rate Histogram in the North West

Hourly rate distribution of jobs citing Migration in the North West over the 6 months to 30 April 2025.

Hourly rate histogram for Migration in the North West

Migration
Contract Job Locations in the North West

The table below looks at the demand and provides a guide to the median contractor rates quoted in IT jobs citing Migration within the North West region over the 6 months to 30 April 2025. The 'Rank Change' column provides an indication of the change in demand within each location based on the same 6 month period last year.

Location Rank Change
on Same Period
Last Year
Matching
Contract
IT Job Ads
Median
Daily Rate
Past 6 Months
Median Daily Rate
% Change
on Same Period
Last Year
Live
Jobs
Manchester +3 89 £504 -4.05% 60
Cheshire +23 49 £475 +18.75% 17
Merseyside 0 17 £550 +12.82% 6
Lancashire +2 14 £570 +11.22% 22
Cumbria +6 9 £475 -9.52% 2
Migration
England

Migration
Co-occurring Skills and Capabilities in the North West by Category

The follow tables expand on the table above by listing co-occurrences grouped by category. The same employment type, locality and period is covered with up to 20 co-occurrences shown in each of the following categories:

Application Platforms
1 13 (7.26%) Microsoft Exchange
1 13 (7.26%) SharePoint
2 6 (3.35%) Confluence
3 5 (2.79%) JBoss
4 4 (2.23%) CICS
5 2 (1.12%) WebSphere
6 1 (0.56%) BizTalk Server
6 1 (0.56%) SAS
6 1 (0.56%) SharePoint Server
Applications
1 6 (3.35%) Microsoft Excel
2 3 (1.68%) Microsoft Office
3 1 (0.56%) MS Visio
Business Applications
1 10 (5.59%) Oracle EBS
2 8 (4.47%) SAP S/4HANA
3 6 (3.35%) Unit4 Business World
4 3 (1.68%) Dynamics CRM
5 2 (1.12%) Payment Gateway
6 1 (0.56%) Distributed Ledger
6 1 (0.56%) Elite 3E
6 1 (0.56%) Remedy ITSM
6 1 (0.56%) SAP HR
6 1 (0.56%) SAP MM
6 1 (0.56%) SAP PP
6 1 (0.56%) SAP QM
Cloud Services
1 25 (13.97%) AWS
1 25 (13.97%) Azure
2 17 (9.50%) Microsoft 365
3 6 (3.35%) Entra ID
3 6 (3.35%) OpenShift
3 6 (3.35%) Power Platform
4 5 (2.79%) OneDrive
5 4 (2.23%) Dynamics 365
5 4 (2.23%) GCP
5 4 (2.23%) SuccessFactors
6 3 (1.68%) Amazon ELB
6 3 (1.68%) SaaS
7 2 (1.12%) AWS Lambda
7 2 (1.12%) IaaS
7 2 (1.12%) Microsoft Purview
7 2 (1.12%) Serverless
8 1 (0.56%) Azure DevOps
8 1 (0.56%) OCI
8 1 (0.56%) Slack
Communications & Networking
1 7 (3.91%) DNS
2 6 (3.35%) DHCP
3 4 (2.23%) Firewall
4 3 (1.68%) MPLS
4 3 (1.68%) VPN
5 2 (1.12%) BGP
5 2 (1.12%) Broadband
5 2 (1.12%) Cisco Firepower
5 2 (1.12%) IPv6
5 2 (1.12%) Multicast
5 2 (1.12%) OSPF
5 2 (1.12%) SD-WAN
5 2 (1.12%) WAN
5 2 (1.12%) Wi-Fi
5 2 (1.12%) Wireless
6 1 (0.56%) Network Security
Database & Business Intelligence
1 15 (8.38%) PostgreSQL
1 15 (8.38%) Relational Database
2 11 (6.15%) SQL Server
3 6 (3.35%) Power BI
3 6 (3.35%) Tableau
4 5 (2.79%) Data Warehouse
4 5 (2.79%) Elasticsearch
4 5 (2.79%) RDBMS
4 5 (2.79%) Siebel EIM
4 5 (2.79%) SQL Server Integration Services
5 3 (1.68%) Data Mining
6 2 (1.12%) DB2
6 2 (1.12%) Easytrieve
6 2 (1.12%) Hadoop
6 2 (1.12%) Metadata
6 2 (1.12%) SQL Server Reporting Services
7 1 (0.56%) Amazon RDS
7 1 (0.56%) Amazon Redshift
7 1 (0.56%) Oracle Database
7 1 (0.56%) Power Query
Development Applications
1 17 (9.50%) Jenkins
1 17 (9.50%) JIRA
2 11 (6.15%) Git
2 11 (6.15%) Liquibase
3 10 (5.59%) Gradle
3 10 (5.59%) JUnit
3 10 (5.59%) Mockito
4 5 (2.79%) Bitbucket Server
4 5 (2.79%) CA Release Automation
4 5 (2.79%) GitLab
4 5 (2.79%) SonarQube
4 5 (2.79%) Sonatype Nexus
4 5 (2.79%) TeamCity
5 3 (1.68%) ScriptRunner
5 3 (1.68%) Selenium
6 2 (1.12%) SOAtest
7 1 (0.56%) Appium
7 1 (0.56%) MSI
7 1 (0.56%) Postman
7 1 (0.56%) SQL Server Management Studio (SSMS)
General
1 58 (32.40%) Social Skills
2 44 (24.58%) Finance
3 29 (16.20%) Public Sector
4 24 (13.41%) Banking
5 17 (9.50%) Analytical Skills
6 16 (8.94%) Manufacturing
7 15 (8.38%) Documentation Skills
8 11 (6.15%) Legal
8 11 (6.15%) Marketing
9 10 (5.59%) Electronics
9 10 (5.59%) Telecoms
10 9 (5.03%) Pharmaceutical
11 4 (2.23%) Inclusion and Diversity
12 3 (1.68%) General Ledger
12 3 (1.68%) Retail Banking
13 2 (1.12%) Aviation
14 1 (0.56%) Corporate Banking
14 1 (0.56%) Investment Banking
14 1 (0.56%) Local Government
14 1 (0.56%) Social Housing
Job Titles
1 31 (17.32%) Architect
2 15 (8.38%) Analyst
3 14 (7.82%) Migration Engineer
3 14 (7.82%) Project Manager
4 13 (7.26%) Business Analyst
5 11 (6.15%) Administrator
5 11 (6.15%) Data Engineer
5 11 (6.15%) Developer
5 11 (6.15%) Solutions Architect
6 10 (5.59%) Network Engineer
7 9 (5.03%) Senior
8 8 (4.47%) Consultant
8 8 (4.47%) Data Migration Engineer
9 7 (3.91%) Cloud Architect
9 7 (3.91%) Lead
9 7 (3.91%) Migration Manager
10 6 (3.35%) Data Architect
11 5 (2.79%) Programme Manager
11 5 (2.79%) Software Engineer
11 5 (2.79%) Test Manager
Libraries, Frameworks & Software Standards
1 15 (8.38%) Spring Boot
2 14 (7.82%) Kafka
3 11 (6.15%) Web Services
4 10 (5.59%) OpenAPI
4 10 (5.59%) React
4 10 (5.59%) Spring
4 10 (5.59%) Swagger
5 6 (3.35%) Elastic Stack
5 6 (3.35%) SOAP
6 5 (2.79%) JMS
6 5 (2.79%) REST
7 4 (2.23%) OAuth
7 4 (2.23%) OAuth2
8 3 (1.68%) D3.js
9 2 (1.12%) J2EE
9 2 (1.12%) JSON
9 2 (1.12%) Pandas
9 2 (1.12%) XML
10 1 (0.56%) Ajax
10 1 (0.56%) ASP.NET
Miscellaneous
1 18 (10.06%) Legacy Systems
2 8 (4.47%) Data Centre
3 7 (3.91%) Product Ownership
4 6 (3.35%) Mainframe
5 5 (2.79%) Hybrid Cloud
5 5 (2.79%) Security Posture
6 4 (2.23%) Management Information System
6 4 (2.23%) VSAM
7 3 (1.68%) Data Structures
7 3 (1.68%) Onboarding
7 3 (1.68%) Public Cloud
8 2 (1.12%) Digital Wallet
8 2 (1.12%) EMV
8 2 (1.12%) Enterprise Software
8 2 (1.12%) Mobile Payment
8 2 (1.12%) Replication
8 2 (1.12%) SWIFT Messaging Network
8 2 (1.12%) Taxonomies
8 2 (1.12%) Virtual Team
9 1 (0.56%) Clustering
Operating Systems
1 21 (11.73%) Windows
2 13 (7.26%) Linux
3 10 (5.59%) Windows Server
4 6 (3.35%) Red Hat Enterprise Linux
5 4 (2.23%) Windows Server 2016
5 4 (2.23%) Windows Server 2019
6 3 (1.68%) Android
6 3 (1.68%) Apple iOS
6 3 (1.68%) Unix
6 3 (1.68%) Windows 10
6 3 (1.68%) Windows Server 2012
7 2 (1.12%) zOS
8 1 (0.56%) HPUX
8 1 (0.56%) Mac OS
8 1 (0.56%) Solaris
Processes & Methodologies
1 53 (29.61%) Data Migration
2 39 (21.79%) Agile
3 38 (21.23%) Problem-Solving
4 28 (15.64%) Stakeholder Management
5 27 (15.08%) DevOps
6 22 (12.29%) Data Modelling
7 21 (11.73%) ETL
8 19 (10.61%) Business Intelligence
8 19 (10.61%) CI/CD
8 19 (10.61%) Microservices
9 17 (9.50%) Change Management
10 16 (8.94%) Project Management
10 16 (8.94%) User Acceptance Testing
11 14 (7.82%) Knowledge Transfer
11 14 (7.82%) Requirements Gathering
11 14 (7.82%) Validation
12 12 (6.70%) Containerisation
12 12 (6.70%) Software Engineering
13 11 (6.15%) Roadmaps
14 10 (5.59%) Digital Marketing
Programming Languages
1 42 (23.46%) SQL
2 19 (10.61%) Java
3 15 (8.38%) PL/SQL
4 12 (6.70%) Python
5 10 (5.59%) TypeScript
6 7 (3.91%) PowerShell
7 5 (2.79%) Perl
8 4 (2.23%) Bash
8 4 (2.23%) COBOL
8 4 (2.23%) JCL
9 3 (1.68%) Groovy
10 2 (1.12%) REXX
11 1 (0.56%) ABAP
11 1 (0.56%) Data Analysis Expressions
11 1 (0.56%) JavaScript
11 1 (0.56%) T-SQL
11 1 (0.56%) VB
11 1 (0.56%) VBScript
Qualifications
1 40 (22.35%) Security Cleared
2 39 (21.79%) SC Cleared
3 5 (2.79%) Degree
4 4 (2.23%) BPSS Clearance
5 2 (1.12%) CCIE
5 2 (1.12%) Cisco Certification
5 2 (1.12%) DBS Check
5 2 (1.12%) Microsoft Certification
6 1 (0.56%) AWS Certification
6 1 (0.56%) AWS Certified Solutions Architect
6 1 (0.56%) Azure Certification
6 1 (0.56%) CIPD
6 1 (0.56%) MCP
6 1 (0.56%) MCSA
6 1 (0.56%) MCSE
6 1 (0.56%) PMI Certification
6 1 (0.56%) PMP
6 1 (0.56%) PRINCE2 Practitioner
6 1 (0.56%) SAP Certification
6 1 (0.56%) VMware Certified Professional (VCP)
Quality Assurance & Compliance
1 10 (5.59%) QA
2 5 (2.79%) Data Quality
2 5 (2.79%) GDPR
3 2 (1.12%) Accessibility
3 2 (1.12%) ISO 20022
3 2 (1.12%) ISO 8583
3 2 (1.12%) PCI DSS
3 2 (1.12%) PSD2
3 2 (1.12%) SEPA
4 1 (0.56%) California Consumer Privacy Act
4 1 (0.56%) NCSC
4 1 (0.56%) PMO
System Software
1 21 (11.73%) Active Directory
2 17 (9.50%) Docker
3 7 (3.91%) VMware Infrastructure
4 3 (1.68%) Hyper-V
4 3 (1.68%) Virtual Desktop
4 3 (1.68%) VMware ESXi
5 1 (0.56%) BitLocker
5 1 (0.56%) Microsoft App-V
5 1 (0.56%) Virtual Machines
Systems Management
1 11 (6.15%) Kubernetes
2 9 (5.03%) Microsoft Intune
2 9 (5.03%) Progress Chef
3 7 (3.91%) Ansible
4 6 (3.35%) Single Sign-On
5 5 (2.79%) Kibana
6 3 (1.68%) Active Directory Federation Services
6 3 (1.68%) Terraform
6 3 (1.68%) vCenter Server
7 2 (1.12%) Nagios
8 1 (0.56%) Grafana
8 1 (0.56%) Prometheus
8 1 (0.56%) SCCM
8 1 (0.56%) SCSM
8 1 (0.56%) WSUS
Vendors
1 37 (20.67%) Microsoft
2 26 (14.53%) Oracle
3 25 (13.97%) SAP
4 10 (5.59%) VMware
5 6 (3.35%) Cisco
5 6 (3.35%) Red Hat
5 6 (3.35%) SolarWinds
5 6 (3.35%) Splunk
6 5 (2.79%) AppDynamics
6 5 (2.79%) Siebel
7 4 (2.23%) Atlassian
7 4 (2.23%) MuleSoft
8 3 (1.68%) Cloudera
8 3 (1.68%) Meraki
9 2 (1.12%) Ab Initio
9 2 (1.12%) AlgoSec
9 2 (1.12%) ForgeRock
9 2 (1.12%) IBM
9 2 (1.12%) Palo Alto
9 2 (1.12%) ServiceNow