Project Management Contracts in Reading

Project Management
Berkshire > Reading

The table below provides summary statistics for contract job vacancies advertised in Reading requiring Project Management skills. It includes a benchmarking guide to the contractor rates offered in vacancies that cited Project Management over the 6 months leading up to 18 June 2024, comparing them to the same period in the previous two years.

6 months to
18 Jun 2024
Same period 2023 Same period 2022
Rank 22 17 6
Rank change year-on-year -5 -11 +18
Contract jobs citing Project Management 96 97 188
As % of all contract jobs advertised in Reading 7.94% 9.26% 13.72%
As % of the Processes & Methodologies category 9.07% 10.52% 15.24%
Number of daily rates quoted 41 68 129
10th Percentile £350 £338 £334
25th Percentile £413 £372 £413
Median daily rate (50th Percentile) £490 £511 £475
Median % change year-on-year -4.16% +7.63% +18.75%
75th Percentile £608 £625 £560
90th Percentile - £688 £615
Berkshire median daily rate £521 £494 £473
% change year-on-year +5.57% +4.44% +9.94%
Number of hourly rates quoted 3 0 0
10th Percentile £53.67 - -
25th Percentile £60.67 - -
Median hourly rate £72.33 - -
75th Percentile - - -
90th Percentile - - -
Berkshire median hourly rate £61.00 £68.55 £80.00
% change year-on-year -11.01% -14.31% +190.91%

All Process and Methodology Skills
Reading

Project Management falls under the Processes and Methodologies category. For comparison with the information above, the following table provides summary statistics for all contract job vacancies requiring process or methodology skills in Reading.

Contract vacancies with a requirement for process or methodology skills 1,058 922 1,234
As % of all contract IT jobs advertised in Reading 87.51% 88.06% 90.07%
Number of daily rates quoted 542 595 794
10th Percentile £214 £363 £247
25th Percentile £413 £456 £400
Median daily rate (50th Percentile) £532 £550 £500
Median % change year-on-year -3.36% +10.00% +3.09%
75th Percentile £625 £675 £600
90th Percentile £688 £721 £655
Berkshire median daily rate £509 £525 £500
% change year-on-year -3.14% +5.00% +6.95%
Number of hourly rates quoted 54 22 9
10th Percentile £15.40 £45.25 £13.15
25th Percentile £51.86 £55.91 £21.25
Median hourly rate £60.83 £68.00 £30.00
Median % change year-on-year -10.54% +126.67% -21.05%
75th Percentile £75.83 £75.56 £34.89
90th Percentile £87.51 £79.19 £38.50
Berkshire median hourly rate £60.53 £63.00 £21.00
% change year-on-year -3.92% +200.00% -2.33%

Project Management
Job Vacancy Trend in Reading

Job postings citing Project Management as a proportion of all IT jobs advertised in Reading.
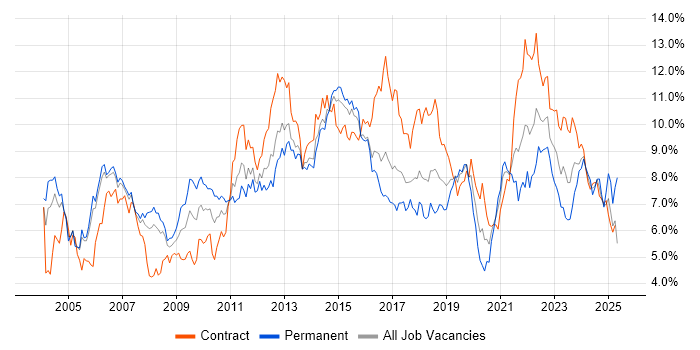
Job vacancy trend for Project Management in Reading

Project Management
Contractor Daily Rate Trend in Reading

3-month moving average daily rate quoted in jobs citing Project Management in Reading.

Daily rate trend for Project Management in Reading

Project Management
Daily Rate Histogram in Reading

Daily rate distribution for jobs citing Project Management in Reading over the 6 months to 18 June 2024.

Daily rate histogram for Project Management in Reading

Project Management
Contractor Hourly Rate Trend in Reading

3-month moving average hourly rates quoted in jobs citing Project Management in Reading.

Hourly rate trend for Project Management in Reading

Project Management
Hourly Rate Histogram in Reading

Hourly rate distribution of jobs citing Project Management in Reading over the 6 months to 18 June 2024.

Hourly rate histogram for Project Management in Reading

Project Management
Co-occurring Skills and Capabilities in Reading by Category

The follow tables expand on the table above by listing co-occurrences grouped by category. The same employment type, locality and period is covered with up to 20 co-occurrences shown in each of the following categories:

Application Platforms
1 5 (5.21%) SAS
2 4 (4.17%) SharePoint
3 2 (2.08%) Confluence
4 1 (1.04%) CMS
Applications
1 14 (14.58%) Microsoft Excel
1 14 (14.58%) Microsoft Office
2 9 (9.38%) Microsoft PowerPoint
3 4 (4.17%) Microsoft Project
4 2 (2.08%) MS Visio
Business Applications
1 2 (2.08%) Primavera
Cloud Services
1 17 (17.71%) Azure
2 14 (14.58%) OCI
3 2 (2.08%) SaaS
4 1 (1.04%) Amazon CloudWatch
4 1 (1.04%) Amazon EC2
4 1 (1.04%) Amazon S3
4 1 (1.04%) AWS
4 1 (1.04%) AWS CloudFormation
4 1 (1.04%) Azure DevOps
4 1 (1.04%) Cloud Computing
4 1 (1.04%) Microsoft 365
4 1 (1.04%) Power Platform
Communications & Networking
1 16 (16.67%) Firewall
2 14 (14.58%) DHCP
2 14 (14.58%) DNS
2 14 (14.58%) SAN
3 7 (7.29%) Radio Access Network
4 2 (2.08%) WAN
5 1 (1.04%) 2G
5 1 (1.04%) 3G
5 1 (1.04%) 4G
5 1 (1.04%) 5G
5 1 (1.04%) LAN
5 1 (1.04%) MPLS
5 1 (1.04%) SDH
5 1 (1.04%) SD-WAN
5 1 (1.04%) SMS
5 1 (1.04%) TCP/IP
5 1 (1.04%) Unified Communications
5 1 (1.04%) VPN
Database & Business Intelligence
1 5 (5.21%) Crystal Reports
2 1 (1.04%) Azure SQL Database
2 1 (1.04%) MySQL
2 1 (1.04%) Power BI
2 1 (1.04%) RDBMS
2 1 (1.04%) Relational Database
2 1 (1.04%) SQL Server
Development Applications
1 5 (5.21%) JIRA
General
1 41 (42.71%) Social Skills
2 32 (33.33%) Telecoms
3 16 (16.67%) Finance
4 12 (12.50%) Inclusion and Diversity
5 9 (9.38%) Mandarin Language
5 9 (9.38%) Public Sector
6 8 (8.33%) Organisational Skills
7 6 (6.25%) Legal
8 5 (5.21%) Analytical Skills
8 5 (5.21%) Presentation Skills
9 4 (4.17%) Marketing
10 2 (2.08%) Retail
11 1 (1.04%) Billing
11 1 (1.04%) Documentation Skills
11 1 (1.04%) Influencing Skills
Job Titles
1 22 (22.92%) Analyst
2 15 (15.63%) Project Manager
2 15 (15.63%) Senior
3 14 (14.58%) Infrastructure Engineer
4 10 (10.42%) Senior Analyst
4 10 (10.42%) Storage Engineer
5 8 (8.33%) Business Analyst
6 6 (6.25%) Delivery Manager
6 6 (6.25%) Lead
7 5 (5.21%) Business Requirements Analyst
7 5 (5.21%) Coordinator
7 5 (5.21%) Developer
7 5 (5.21%) IFS Developer
7 5 (5.21%) Requirements Analyst
7 5 (5.21%) Senior Manager
7 5 (5.21%) Senior Project Manager
7 5 (5.21%) Senior Requirements Analyst
8 4 (4.17%) DV Cleared Project Manager
8 4 (4.17%) PMO Analyst
8 4 (4.17%) Telecoms Analyst
Libraries, Frameworks & Software Standards
1 1 (1.04%) ADO
1 1 (1.04%) Elastic Stack
Miscellaneous
1 14 (14.58%) Data Centre
2 4 (4.17%) Driving Licence
3 3 (3.13%) Legacy Systems
4 2 (2.08%) Data Protection Act
5 1 (1.04%) Management Information System
5 1 (1.04%) Product Ownership
5 1 (1.04%) Public Cloud
5 1 (1.04%) Renewable Energy
Operating Systems
1 16 (16.67%) Windows
2 15 (15.63%) Linux
3 14 (14.58%) Windows 10
3 14 (14.58%) Windows Server
3 14 (14.58%) Windows Server 2012
3 14 (14.58%) Windows Server 2016
3 14 (14.58%) Windows Server 2019
3 14 (14.58%) Windows XP
Processes & Methodologies
1 32 (33.33%) Problem-Solving
2 26 (27.08%) Project Delivery
3 17 (17.71%) Collaborative Working
3 17 (17.71%) ITIL
4 14 (14.58%) Break/Fix
4 14 (14.58%) Converged Infrastructure
4 14 (14.58%) Disaster Recovery
4 14 (14.58%) Infrastructure Engineering
4 14 (14.58%) Performance Monitoring
4 14 (14.58%) Performance Tuning
4 14 (14.58%) Proactive Monitoring
4 14 (14.58%) Server Management
4 14 (14.58%) Storage Management
5 13 (13.54%) Business Analysis
5 13 (13.54%) Portfolio Management
6 12 (12.50%) Agile
6 12 (12.50%) Change Management
6 12 (12.50%) Customer-Centricity
6 12 (12.50%) Stakeholder Management
7 11 (11.46%) Acceptance Criteria
Programming Languages
1 14 (14.58%) PowerShell
2 6 (6.25%) SQL
Qualifications
1 27 (28.13%) Degree
2 25 (26.04%) Security Cleared
3 22 (22.92%) DV Cleared
4 17 (17.71%) SC Cleared
5 14 (14.58%) CCNA
5 14 (14.58%) CCNP
5 14 (14.58%) Cisco Certification
6 4 (4.17%) PMP
7 2 (2.08%) PMI Certification
8 1 (1.04%) ACCA
8 1 (1.04%) APMG
8 1 (1.04%) CIMA
8 1 (1.04%) PRINCE2 Certification
Quality Assurance & Compliance
1 17 (17.71%) PMO
2 5 (5.21%) QA
3 3 (3.13%) SLA
4 1 (1.04%) ITGC
4 1 (1.04%) P3O
4 1 (1.04%) Sarbanes-Oxley
System Software
1 14 (14.58%) Active Directory
1 14 (14.58%) Hyper-V
1 14 (14.58%) VMware ESXi
1 14 (14.58%) VMware Infrastructure
Systems Management
1 15 (15.63%) SCCM
2 14 (14.58%) EMC NetWorker
2 14 (14.58%) NetBackup
2 14 (14.58%) SCOM
2 14 (14.58%) vCenter Server
2 14 (14.58%) WSUS
3 1 (1.04%) Ansible
3 1 (1.04%) Grafana
3 1 (1.04%) Graylog
3 1 (1.04%) Microsoft Intune
3 1 (1.04%) Nagios
3 1 (1.04%) Prometheus
3 1 (1.04%) Terraform
Vendors
1 25 (26.04%) Microsoft
2 16 (16.67%) Cisco
3 15 (15.63%) EMC
3 15 (15.63%) Oracle
4 14 (14.58%) 3PAR
4 14 (14.58%) Dell
4 14 (14.58%) Extreme Networks
4 14 (14.58%) HP
4 14 (14.58%) Juniper
4 14 (14.58%) Palo Alto
4 14 (14.58%) Symantec
4 14 (14.58%) Veeam
4 14 (14.58%) VMware
5 6 (6.25%) IFS
6 2 (2.08%) SAP
7 1 (1.04%) CheckPoint
7 1 (1.04%) IBM
7 1 (1.04%) Isilon
7 1 (1.04%) Salesforce
7 1 (1.04%) Splunk