Product Ownership Jobs in Berkshire

Product Ownership
South East > Berkshire

The table below looks at the prevalence of the term Product Ownership in permanent job vacancies advertised in Berkshire. Included is a benchmarking guide to the salaries offered in vacancies that have cited Product Ownership over the 6 months to 27 April 2024 with a comparison to the same period over the previous 2 years.

6 months to
27 Apr 2024
Same period 2023 Same period 2022
Rank 98 46 41
Rank change year-on-year -52 -5 +26
Permanent jobs citing Product Ownership 65 187 214
As % of all permanent jobs advertised in Berkshire 2.11% 5.88% 6.29%
As % of the Miscellaneous category 7.17% 12.94% 15.76%
Number of salaries quoted 33 93 70
10th Percentile £58,000 £46,570 £32,500
25th Percentile £62,500 £52,500 £46,750
Median annual salary (50th Percentile) £67,500 £57,500 £63,750
Median % change year-on-year +17.39% -9.80% +15.91%
75th Percentile £82,500 £68,750 £74,688
90th Percentile £86,000 £83,750 £82,200
South East median annual salary £65,000 £62,500 £57,500
% change year-on-year +4.00% +8.70% +4.55%

All Generic Skills
Berkshire

Product Ownership is in the General and Transferable Skills category. The following table is for comparison with the above and provides summary statistics for all permanent job vacancies advertised in Berkshire with a requirement for generic IT skills.

Permanent vacancies with a requirement for generic IT skills 907 1,445 1,358
As % of all permanent jobs advertised in Berkshire 29.42% 45.43% 39.89%
Number of salaries quoted 638 713 732
10th Percentile £28,100 £35,000 £32,500
25th Percentile £34,750 £44,525 £42,500
Median annual salary (50th Percentile) £50,000 £58,000 £60,000
Median % change year-on-year -13.79% -3.33% -
75th Percentile £62,500 £73,963 £73,938
90th Percentile £77,500 £88,750 £83,750
South East median annual salary £49,000 £55,000 £55,000
% change year-on-year -10.91% - +4.76%

Product Ownership
Job Vacancy Trend in Berkshire

Job postings citing Product Ownership as a proportion of all IT jobs advertised in Berkshire.
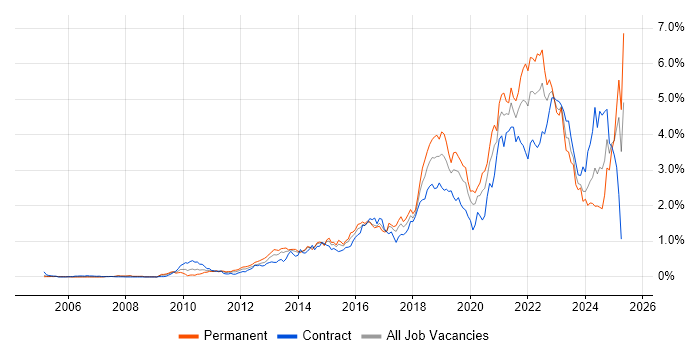
Job vacancy trend for Product Ownership in Berkshire

Product Ownership
Salary Trend in Berkshire

3-month moving average salary quoted in jobs citing Product Ownership in Berkshire.

Salary trend for Product Ownership in Berkshire

Product Ownership
Salary Histogram in Berkshire

Salary distribution for jobs citing Product Ownership in Berkshire over the 6 months to 27 April 2024.

Salary histogram for Product Ownership in Berkshire

Product Ownership
Job Locations in Berkshire

The table below looks at the demand and provides a guide to the median salaries quoted in IT jobs citing Product Ownership within the Berkshire region over the 6 months to 27 April 2024. The 'Rank Change' column provides an indication of the change in demand within each location based on the same 6 month period last year.

Location Rank Change
on Same Period
Last Year
Matching
Permanent
IT Job Ads
Median Salary
Past 6 Months
Median Salary
% Change
on Same Period
Last Year
Live
Jobs
Reading -45 39 £77,500 +23.26% 8
Bracknell +2 6 £65,000 -
Newbury +19 3 - - 3
Wokingham -2 2 £55,000 - 1
Slough -2 2 £70,000 +27.27% 2
Maidenhead +5 1 - - 2
Windsor - 1 - - 1
Product Ownership
South East

Product Ownership
Co-occurring Skills and Capabilities in Berkshire by Category

The follow tables expand on the table above by listing co-occurrences grouped by category. The same employment type, locality and period is covered with up to 20 co-occurrences shown in each of the following categories:

Application Platforms
1 7 (10.77%) Confluence
2 1 (1.54%) SharePoint
Applications
1 6 (9.23%) MS Visio
2 3 (4.62%) Trello
3 2 (3.08%) Microsoft Excel
4 1 (1.54%) Microsoft Office
4 1 (1.54%) Microsoft PowerPoint
Cloud Services
1 17 (26.15%) Power Platform
2 15 (23.08%) AWS
3 9 (13.85%) Azure
4 3 (4.62%) Asana
4 3 (4.62%) Cloud Computing
4 3 (4.62%) Serverless
5 2 (3.08%) Azure DevOps
5 2 (3.08%) Azure Functions
6 1 (1.54%) Amazon Cognito
6 1 (1.54%) Amazon ElastiCache
6 1 (1.54%) AWS Fargate
6 1 (1.54%) AWS KMS
6 1 (1.54%) AWS Lambda
6 1 (1.54%) Azure Data Factory
6 1 (1.54%) Azure WebJobs
6 1 (1.54%) GitHub Actions
6 1 (1.54%) PaaS
6 1 (1.54%) PowerApps
6 1 (1.54%) SaaS
6 1 (1.54%) WhatsApp
Communications & Networking
1 1 (1.54%) DMZ
1 1 (1.54%) Firewall
1 1 (1.54%) Modbus
1 1 (1.54%) Reverse Proxy
1 1 (1.54%) TCP/IP
1 1 (1.54%) VLAN
1 1 (1.54%) VPN
Database & Business Intelligence
1 16 (24.62%) Power BI
2 4 (6.15%) NoSQL
3 2 (3.08%) Amazon Aurora
3 2 (3.08%) Big Data
3 2 (3.08%) DynamoDB
3 2 (3.08%) Elasticsearch
3 2 (3.08%) PostgreSQL
3 2 (3.08%) Relational Database
3 2 (3.08%) SQL Server
4 1 (1.54%) Amazon RDS
4 1 (1.54%) Azure SQL Database
4 1 (1.54%) DocumentDB
4 1 (1.54%) Hadoop
4 1 (1.54%) Redis
Development Applications
1 13 (20.00%) JIRA
2 11 (16.92%) Jenkins
3 4 (6.15%) Cypress.io
3 4 (6.15%) SoapUI
4 3 (4.62%) Selenium
5 2 (3.08%) Burp Suite
5 2 (3.08%) Git
5 2 (3.08%) Postman
5 2 (3.08%) REST Assured
5 2 (3.08%) WebDriver
6 1 (1.54%) Visual Studio
6 1 (1.54%) Visual Studio Code
General
1 18 (27.69%) Marketing
2 17 (26.15%) Analytical Skills
2 17 (26.15%) Telecoms
3 14 (21.54%) Brand Awareness
4 7 (10.77%) Publishing
5 4 (6.15%) Social Skills
6 3 (4.62%) Finance
6 3 (4.62%) Influencing Skills
7 2 (3.08%) Legal
8 1 (1.54%) Aerospace
8 1 (1.54%) Billing
8 1 (1.54%) Documentation Skills
8 1 (1.54%) Manufacturing
8 1 (1.54%) Public Sector
8 1 (1.54%) Retail
Job Titles
1 14 (21.54%) Customer Experience Manager
2 11 (16.92%) Analyst
3 10 (15.38%) DevOps Engineer
4 7 (10.77%) Business Analyst
5 5 (7.69%) Senior
6 3 (4.62%) AWS Engineer
6 3 (4.62%) Developer
6 3 (4.62%) IT Manager
6 3 (4.62%) IT Project Manager
6 3 (4.62%) Platform Manager
6 3 (4.62%) Product Owner
6 3 (4.62%) Project Manager
6 3 (4.62%) QA Engineer
6 3 (4.62%) Senior User Researcher
6 3 (4.62%) Software Manager
6 3 (4.62%) User Researcher
7 2 (3.08%) Automation Engineer
7 2 (3.08%) Full Stack Developer
7 2 (3.08%) Platform Engineer
7 2 (3.08%) QA Automation Engineer
Libraries, Frameworks & Software Standards
1 5 (7.69%) .NET
2 4 (6.15%) React
3 3 (4.62%) CSS
3 3 (4.62%) REST
4 2 (3.08%) Blazor
4 2 (3.08%) Jest
4 2 (3.08%) Razor View Engine
4 2 (3.08%) Web Services
5 1 (1.54%) AngularJS
5 1 (1.54%) HTML
5 1 (1.54%) jQuery
5 1 (1.54%) Lightning Web Components
5 1 (1.54%) Middleware
5 1 (1.54%) SOAP
5 1 (1.54%) SPFx
5 1 (1.54%) XML
Miscellaneous
1 3 (4.62%) Mobile App
2 2 (3.08%) Driving Licence
2 2 (3.08%) SCADA
3 1 (1.54%) Blog
3 1 (1.54%) LIMS
3 1 (1.54%) Low-Code
3 1 (1.54%) Management Information System
3 1 (1.54%) Renewable Energy
3 1 (1.54%) Smart Meter
3 1 (1.54%) Video on Demand
Operating Systems
1 13 (20.00%) Linux
2 1 (1.54%) CentOS
2 1 (1.54%) Debian
2 1 (1.54%) Red Hat Enterprise Linux
2 1 (1.54%) Ubuntu
2 1 (1.54%) Unix
2 1 (1.54%) Windows
Processes & Methodologies
1 53 (81.54%) Agile
2 21 (32.31%) Project Management
3 20 (30.77%) Backlog Prioritisation
3 20 (30.77%) CRM
4 19 (29.23%) Customer Experience
5 18 (27.69%) DevOps
6 17 (26.15%) Continuous Improvement
7 16 (24.62%) B2B
7 16 (24.62%) Customer-Centricity
7 16 (24.62%) Objectives and Key Results
8 15 (23.08%) A/B Testing
8 15 (23.08%) CI/CD
8 15 (23.08%) Digital Marketing
8 15 (23.08%) Prototyping
8 15 (23.08%) Wireframes
9 14 (21.54%) Email Marketing
9 14 (21.54%) Marketing Strategy
9 14 (21.54%) Order to Cash
9 14 (21.54%) Performance Metrics
9 14 (21.54%) Usability Testing
Programming Languages
1 14 (21.54%) C
2 11 (16.92%) Groovy
3 8 (12.31%) C#
3 8 (12.31%) JavaScript
4 7 (10.77%) SQL
5 5 (7.69%) TypeScript
6 3 (4.62%) Java
6 3 (4.62%) Python
7 2 (3.08%) PowerShell
Qualifications
1 20 (30.77%) Degree
2 19 (29.23%) SC Cleared
2 19 (29.23%) Security Cleared
3 5 (7.69%) AWS Certification
4 1 (1.54%) ISTQB
4 1 (1.54%) Master's Degree
4 1 (1.54%) PMI Certification
4 1 (1.54%) PMP
Quality Assurance & Compliance
1 8 (12.31%) QA
2 3 (4.62%) Accessibility
2 3 (4.62%) SLA
3 1 (1.54%) GDPR
3 1 (1.54%) NIST
3 1 (1.54%) PMO
System Software
1 15 (23.08%) Docker
Systems Management
1 15 (23.08%) Kubernetes
2 12 (18.46%) Terraform
3 1 (1.54%) Ansible
3 1 (1.54%) Grafana
3 1 (1.54%) Kustomize
Vendors
1 4 (6.15%) Salesforce
2 3 (4.62%) Microsoft
3 2 (3.08%) Adobe
3 2 (3.08%) Oracle
4 1 (1.54%) Ab Initio
4 1 (1.54%) MuleSoft
4 1 (1.54%) New Relic
4 1 (1.54%) Splunk