Senior Jobs in Berkshire

Senior
South East > Berkshire

The median Senior salary in Berkshire is £67,500 per year, according to job vacancies posted during the 6 months leading to 31 May 2025.

The table below provides salary benchmarking and summary statistics, comparing them to the same period in the previous two years.

6 months to
31 May 2025
Same period 2024 Same period 2023
Rank 9 5 9
Rank change year-on-year -4 +4 -2
Permanent jobs requiring a Senior 284 545 446
As % of all permanent jobs advertised in Berkshire 17.22% 16.89% 14.72%
As % of the Job Titles category 21.21% 17.69% 15.93%
Number of salaries quoted 83 324 280
10th Percentile £50,848 £45,000 £45,775
25th Percentile £58,750 £55,000 £57,500
Median annual salary (50th Percentile) £67,500 £67,500 £70,000
Median % change year-on-year - -3.57% +7.69%
75th Percentile £79,375 £80,313 £85,000
90th Percentile £86,250 £92,500 £95,000
South East median annual salary £62,000 £60,000 £67,500
% change year-on-year +3.33% -11.11% +3.85%

All Permanent IT Job Vacancies
Berkshire

For comparison with the information above, the following table provides summary statistics for all permanent IT job vacancies in Berkshire. Most job vacancies include a discernible job title that can be normalized. As such, the figures in the second row provide an indication of the number of permanent jobs in our overall sample.

Permanent vacancies in Berkshire with a recognized job title 1,339 3,080 2,799
% of permanent jobs with a recognized job title 81.20% 95.47% 92.41%
Number of salaries quoted 590 2,128 1,601
10th Percentile £29,500 £30,000 £31,250
25th Percentile £38,183 £38,000 £41,250
Median annual salary (50th Percentile) £57,000 £52,500 £57,500
Median % change year-on-year +8.57% -8.70% -
75th Percentile £75,000 £70,000 £75,000
90th Percentile £87,275 £82,500 £93,750
South East median annual salary £55,000 £50,000 £55,000
% change year-on-year +10.00% -9.09% -

Senior
Job Vacancy Trend in Berkshire

Job postings that featured Senior in the job title as a proportion of all IT jobs advertised in Berkshire.
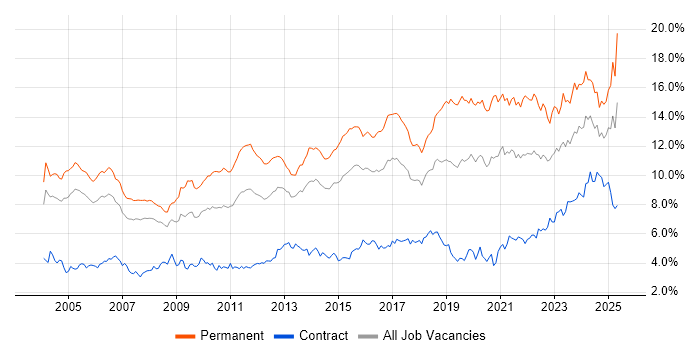
Job vacancy trend for Senior in Berkshire

Senior
Salary Trend in Berkshire

3-month moving average salary quoted in jobs citing Senior in Berkshire.

Salary trend for Senior in Berkshire

Senior
Salary Histogram in Berkshire

Salary distribution for jobs citing Senior in Berkshire over the 6 months to 31 May 2025.

Salary histogram for Senior in Berkshire

Senior
Job Locations in Berkshire

The table below looks at the demand and provides a guide to the median salaries quoted in IT jobs citing Senior within the Berkshire region over the 6 months to 31 May 2025. The 'Rank Change' column provides an indication of the change in demand within each location based on the same 6 month period last year.

Location Rank Change
on Same Period
Last Year
Matching
Permanent
IT Job Ads
Median Salary
Past 6 Months
Median Salary
% Change
on Same Period
Last Year
Live
Jobs
Slough +2 92 £67,500 - 30
Windsor +3 58 £33,500 -10.67% 2
Maidenhead +13 56 £70,000 +16.67% 9
Reading -22 43 £65,000 +8.33% 82
Bracknell +8 21 £77,500 -8.82% 13
Wokingham -1 1 £65,000 -13.33% 2
Senior
South East

Senior Skill Set
Top 30 Co-occurring Skills and Capabilities in Berkshire

For the 6 months to 31 May 2025, Senior job roles required the following skills and capabilities in order of popularity. The figures indicate the absolute number co-occurrences and as a proportion of all permanent job ads across the Berkshire region featuring Senior in the job title.

1 171 (60.21%) Law
2 158 (55.63%) Social Skills
3 117 (41.20%) Analytics
4 110 (38.73%) Problem-Solving
5 109 (38.38%) Degree
6 106 (37.32%) Agile
7 103 (36.27%) Roadmaps
8 96 (33.80%) Azure
8 96 (33.80%) Analytical Skills
9 81 (28.52%) Machine Learning
10 80 (28.17%) Data Science
11 76 (26.76%) Artificial Intelligence
12 71 (25.00%) Strategic Thinking
13 67 (23.59%) Stakeholder Management
14 65 (22.89%) Strategic Roadmap
15 61 (21.48%) Microsoft
16 59 (20.77%) Legal
17 58 (20.42%) SQL
18 57 (20.07%) Data Lake
19 56 (19.72%) Change Management
19 56 (19.72%) Influencing Skills
20 55 (19.37%) Finance
21 54 (19.01%) Project Management
21 54 (19.01%) Computer Science
22 52 (18.31%) Continuous Improvement
23 51 (17.96%) Data Engineering
24 48 (16.90%) Use Case
25 47 (16.55%) Data Management
26 46 (16.20%) GCP
26 46 (16.20%) Data Quality

Senior Skill Set
Co-occurring Skills and Capabilities in Berkshire by Category

The follow tables expand on the table above by listing co-occurrences grouped by category. The same employment type, locality and period is covered with up to 20 co-occurrences shown in each of the following categories:

Application Platforms
1 4 (1.41%) SharePoint
2 3 (1.06%) Microsoft Exchange
3 1 (0.35%) Apache
3 1 (0.35%) Apache Spark
3 1 (0.35%) Confluence
Applications
1 2 (0.70%) Microsoft Office
2 1 (0.35%) Microsoft Excel
Business Applications
1 16 (5.63%) OpenText VIM for SAP
1 16 (5.63%) SAP FI
2 4 (1.41%) Dynamics NAV
3 3 (1.06%) Dynamics CRM
4 2 (0.70%) Oracle ERP
5 1 (0.35%) Salesforce CRM
5 1 (0.35%) SAP BPC
5 1 (0.35%) SAP GRC
5 1 (0.35%) SAP S/4HANA
Cloud Services
1 96 (33.80%) Azure
2 46 (16.20%) GCP
3 44 (15.49%) AWS
4 24 (8.45%) Snowflake
5 16 (5.63%) Azure Monitor
6 15 (5.28%) Vertex AI
7 14 (4.93%) Salsify
8 13 (4.58%) Microsoft 365
9 11 (3.87%) Azure Data Factory
10 9 (3.17%) Azure Synapse Analytics
11 5 (1.76%) Collibra
11 5 (1.76%) Microsoft Purview
12 4 (1.41%) Entra ID
13 3 (1.06%) Azure Cosmos DB
13 3 (1.06%) Serverless
14 2 (0.70%) Amazon EC2
14 2 (0.70%) Azure DevOps
14 2 (0.70%) Azure Functions
14 2 (0.70%) Azure Key Vault
14 2 (0.70%) GitHub
Communications & Networking
1 11 (3.87%) VPN
2 8 (2.82%) VLAN
3 7 (2.46%) Firewall
3 7 (2.46%) VoIP
4 4 (1.41%) DNS
5 3 (1.06%) DHCP
6 2 (0.70%) Network Security
6 2 (0.70%) SCCP
7 1 (0.35%) BGP
7 1 (0.35%) Cisco ASA
7 1 (0.35%) Cisco Firepower
7 1 (0.35%) Cisco ISE
7 1 (0.35%) Cisco Nexus
7 1 (0.35%) HSRP
7 1 (0.35%) IPsec
7 1 (0.35%) OSPF
7 1 (0.35%) Spanning Tree
Database & Business Intelligence
1 57 (20.07%) Data Lake
2 40 (14.08%) Metadata
3 26 (9.15%) OLTP
4 24 (8.45%) Data Mining
4 24 (8.45%) Data Warehouse
5 10 (3.52%) SQL Server
6 7 (2.46%) NoSQL
7 4 (1.41%) Metabase
8 3 (1.06%) Big Data
9 2 (0.70%) Amazon Aurora
9 2 (0.70%) Amazon RDS
9 2 (0.70%) PostgreSQL
9 2 (0.70%) RDBMS
9 2 (0.70%) Relational Database
10 1 (0.35%) DynamoDB
10 1 (0.35%) Hadoop
10 1 (0.35%) MongoDB
10 1 (0.35%) Oracle Reports
10 1 (0.35%) SAP HANA
10 1 (0.35%) Weaviate
Development Applications
1 12 (4.23%) Git
2 4 (1.41%) Visual Studio
3 3 (1.06%) Selenium
4 2 (0.70%) Cypress.io
4 2 (0.70%) Jenkins
4 2 (0.70%) JIRA
4 2 (0.70%) JUnit
4 2 (0.70%) Maven
5 1 (0.35%) Bitbucket Server
5 1 (0.35%) DbUnit
5 1 (0.35%) Gradle
5 1 (0.35%) jMock
5 1 (0.35%) MLflow
5 1 (0.35%) Mockito
5 1 (0.35%) SonarQube
5 1 (0.35%) Visual Studio Code
General
1 171 (60.21%) Law
2 158 (55.63%) Social Skills
3 96 (33.80%) Analytical Skills
4 59 (20.77%) Legal
5 56 (19.72%) Influencing Skills
6 55 (19.37%) Finance
7 33 (11.62%) Retail
8 30 (10.56%) Marketing
9 6 (2.11%) Manufacturing
10 5 (1.76%) Presentation Skills
11 4 (1.41%) Public Sector
12 3 (1.06%) Advertising
12 3 (1.06%) Electronics
13 1 (0.35%) Aerospace
13 1 (0.35%) Automotive
13 1 (0.35%) Pharmaceutical
13 1 (0.35%) Telecoms
Libraries, Frameworks & Software Standards
1 27 (9.51%) HTML
2 17 (5.99%) SOAP
3 15 (5.28%) XML
4 14 (4.93%) PyTorch
4 14 (4.93%) TensorFlow
5 13 (4.58%) Hugging Face
5 13 (4.58%) LangChain
6 10 (3.52%) React
7 9 (3.17%) JSON
8 7 (2.46%) .NET
9 5 (1.76%) AngularJS
9 5 (1.76%) REST
10 3 (1.06%) CSS
10 3 (1.06%) Spring
11 2 (0.70%) ActiveMQ
11 2 (0.70%) CSS3
11 2 (0.70%) Hibernate
11 2 (0.70%) JPA
11 2 (0.70%) Node.js
11 2 (0.70%) Web Services
Miscellaneous
1 33 (11.62%) Analytical Mindset
2 30 (10.56%) Algorithms
3 18 (6.34%) Management Information System
4 14 (4.93%) Taxonomies
5 13 (4.58%) Self-Motivation
6 5 (1.76%) Product Ownership
7 4 (1.41%) CCTV
7 4 (1.41%) CESG
7 4 (1.41%) Linux Command Line
7 4 (1.41%) Onboarding
8 3 (1.06%) Data Centre
8 3 (1.06%) Digital Media
8 3 (1.06%) Driving Licence
8 3 (1.06%) Marketing Technology
9 2 (0.70%) Acoustics
9 2 (0.70%) Cloud Native
9 2 (0.70%) Data Structures
9 2 (0.70%) Enterprise Software
9 2 (0.70%) Security Operations Centre
10 1 (0.35%) Virtual Team
Operating Systems
1 14 (4.93%) Linux
2 10 (3.52%) Windows
3 9 (3.17%) Mac OS
4 6 (2.11%) Unix
5 4 (1.41%) Android
5 4 (1.41%) Windows Server
6 3 (1.06%) Windows 10
6 3 (1.06%) Windows Server 2016
7 2 (0.70%) Apple iOS
8 1 (0.35%) VMS
Processes & Methodologies
1 117 (41.20%) Analytics
2 110 (38.73%) Problem-Solving
3 106 (37.32%) Agile
4 103 (36.27%) Roadmaps
5 81 (28.52%) Machine Learning
6 80 (28.17%) Data Science
7 76 (26.76%) Artificial Intelligence
8 71 (25.00%) Strategic Thinking
9 67 (23.59%) Stakeholder Management
10 65 (22.89%) Strategic Roadmap
11 56 (19.72%) Change Management
12 54 (19.01%) Computer Science
12 54 (19.01%) Project Management
13 52 (18.31%) Continuous Improvement
14 51 (17.96%) Data Engineering
15 48 (16.90%) Use Case
16 47 (16.55%) Data Management
17 45 (15.85%) Data Governance
18 43 (15.14%) Actionable Insight
18 43 (15.14%) Generative AI
Programming Languages
1 58 (20.42%) SQL
2 40 (14.08%) Python
3 26 (9.15%) PL/SQL
4 17 (5.99%) JavaScript
5 14 (4.93%) Java
6 13 (4.58%) C++
7 11 (3.87%) C#
8 7 (2.46%) Bash
8 7 (2.46%) TypeScript
9 6 (2.11%) C
9 6 (2.11%) Fortran
10 3 (1.06%) PHP
11 2 (0.70%) Kusto Query Language
12 1 (0.35%) PowerShell
12 1 (0.35%) R
12 1 (0.35%) Swift
12 1 (0.35%) VBA
Qualifications
1 109 (38.38%) Degree
2 24 (8.45%) Master's Degree
3 23 (8.10%) Computer Science Degree
4 11 (3.87%) Security Cleared
5 9 (3.17%) Microsoft Certification
5 9 (3.17%) SC Cleared
6 7 (2.46%) MCP
7 6 (2.11%) CISSP
7 6 (2.11%) PhD
8 5 (1.76%) MBA
9 4 (1.41%) A+ Certification
9 4 (1.41%) CESG Certified Professional
9 4 (1.41%) Dell Certification
9 4 (1.41%) DV Cleared
9 4 (1.41%) ISO 27001 Lead Auditor
10 3 (1.06%) Cisco Certification
10 3 (1.06%) DBS Check
10 3 (1.06%) MCSA
11 2 (0.70%) PMI Certification
11 2 (0.70%) PMP
Quality Assurance & Compliance
1 46 (16.20%) Data Quality
2 28 (9.86%) QA
3 26 (9.15%) Accessibility
4 8 (2.82%) ISO/IEC 27001
5 4 (1.41%) GMP
6 2 (0.70%) WCAG
System Software
1 12 (4.23%) Docker
2 11 (3.87%) Active Directory
3 4 (1.41%) Hyper-V
4 3 (1.06%) VMware Infrastructure
5 1 (0.35%) HDFS
5 1 (0.35%) IAG
5 1 (0.35%) Virtual Desktop
Systems Management
1 13 (4.58%) Grafana
1 13 (4.58%) Prometheus
2 8 (2.82%) Kubernetes
3 2 (0.70%) Ansible
3 2 (0.70%) Microsoft Intune
3 2 (0.70%) Terraform
4 1 (0.35%) EMC NetWorker
4 1 (0.35%) Kubeflow
4 1 (0.35%) Single Sign-On
Vendors
1 61 (21.48%) Microsoft
2 29 (10.21%) Oracle
3 28 (9.86%) OpenAI
4 18 (6.34%) SAP
5 15 (5.28%) Google
6 13 (4.58%) Salesforce
7 9 (3.17%) Databricks
8 5 (1.76%) Informatica
9 4 (1.41%) Dell
10 3 (1.06%) Apple
10 3 (1.06%) SonicWALL
10 3 (1.06%) VMware
11 2 (0.70%) Jaspersoft
11 2 (0.70%) PeopleSoft
12 1 (0.35%) Atlassian
12 1 (0.35%) Cisco
12 1 (0.35%) F5
12 1 (0.35%) HubSpot
12 1 (0.35%) IBM
12 1 (0.35%) Juniper