Senior Jobs in the South East

Senior
England > South East

The median Senior salary in the South East is £62,000 per year, according to job vacancies posted during the 6 months leading to 15 June 2025.

The table below provides salary benchmarking and summary statistics, comparing them to the same period in the previous two years.

6 months to
15 Jun 2025
Same period 2024 Same period 2023
Rank 5 9 8
Rank change year-on-year +4 -1 +5
Permanent jobs requiring a Senior 1,494 2,404 1,920
As % of all permanent jobs advertised in the South East 15.53% 12.83% 14.58%
As % of the Job Titles category 17.66% 13.60% 16.27%
Number of salaries quoted 719 1,586 1,204
10th Percentile £46,200 £42,500 £47,500
25th Percentile £55,000 £50,000 £55,000
Median annual salary (50th Percentile) £62,000 £60,000 £67,500
Median % change year-on-year +3.33% -11.11% +3.85%
75th Percentile £67,500 £71,250 £77,500
90th Percentile £76,250 £85,000 £87,500
England median annual salary £62,000 £62,783 £70,000
% change year-on-year -1.25% -10.31% -

All Permanent IT Job Vacancies
South East

For comparison with the information above, the following table provides summary statistics for all permanent IT job vacancies in the South East. Most job vacancies include a discernible job title that can be normalized. As such, the figures in the second row provide an indication of the number of permanent jobs in our overall sample.

Permanent vacancies in the South East with a recognized job title 8,460 17,675 11,800
% of permanent jobs with a recognized job title 87.96% 94.33% 89.60%
Number of salaries quoted 4,544 12,442 7,770
10th Percentile £29,000 £27,750 £30,000
25th Percentile £39,000 £36,250 £40,000
Median annual salary (50th Percentile) £55,000 £50,000 £55,000
Median % change year-on-year +10.00% -9.09% -
75th Percentile £68,750 £65,000 £71,250
90th Percentile £77,500 £77,500 £85,000
England median annual salary £55,000 £52,500 £60,259
% change year-on-year +4.76% -12.88% +0.43%

Senior
Job Vacancy Trend in the South East

Job postings that featured Senior in the job title as a proportion of all IT jobs advertised in the South East.
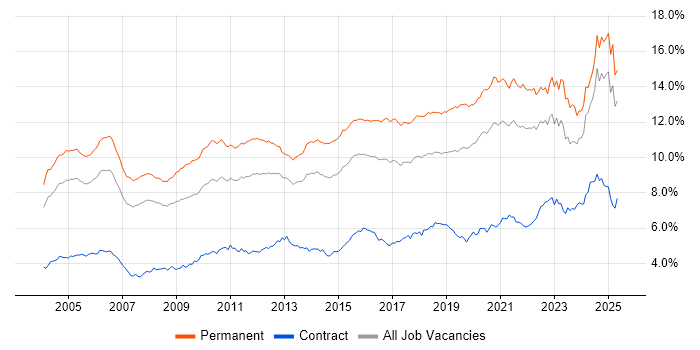
Job vacancy trend for Senior in the South East

Senior
Salary Trend in the South East

3-month moving average salary quoted in jobs citing Senior in the South East.

Salary trend for Senior in the South East

Senior
Salary Histogram in the South East

Salary distribution for jobs citing Senior in the South East over the 6 months to 15 June 2025.

Salary histogram for Senior in the South East

Senior
Job Locations in the South East

The table below looks at the demand and provides a guide to the median salaries quoted in IT jobs citing Senior within the South East region over the 6 months to 15 June 2025. The 'Rank Change' column provides an indication of the change in demand within each location based on the same 6 month period last year.

Location Rank Change
on Same Period
Last Year
Matching
Permanent
IT Job Ads
Median Salary
Past 6 Months
Median Salary
% Change
on Same Period
Last Year
Live
Jobs
Thames Valley -4 475 £65,000 +5.69% 939
Isle of Wight - 371 £62,000 - 14
Berkshire -3 306 £67,500 - 784
Hampshire +4 253 £55,000 -9.09% 199
Surrey -2 165 £65,000 +8.33% 109
Kent +7 117 £55,000 -8.33% 58
Buckinghamshire -20 115 £60,000 +9.09% 62
Middlesex +3 71 - - 11
Oxfordshire -18 54 £60,000 - 101
West Sussex -2 19 £55,000 -4.35% 28
East Sussex -17 19 £70,000 +27.27% 45
Sussex -2 1 £75,000 +29.31% 33
Senior
England

Senior Skill Set
Top 30 Co-occurring Skills and Capabilities in the South East

For the 6 months to 15 June 2025, Senior job roles required the following skills and capabilities in order of popularity. The figures indicate the absolute number co-occurrences and as a proportion of all permanent job ads across the South East region featuring Senior in the job title.

1 557 (37.28%) Degree
2 517 (34.61%) BPSS Clearance
3 384 (25.70%) Problem-Solving
4 368 (24.63%) Systems Engineering
5 361 (24.16%) Social Skills
6 314 (21.02%) Agile
7 272 (18.21%) Mentoring
8 241 (16.13%) Python
9 240 (16.06%) ISO/IEC 15288
10 231 (15.46%) Electronics
10 231 (15.46%) Azure
11 227 (15.19%) Law
12 209 (13.99%) Analytical Skills
13 204 (13.65%) Algorithms
14 202 (13.52%) Technical Leadership
15 182 (12.18%) Analytics
16 181 (12.12%) Microsoft
17 178 (11.91%) Finance
18 177 (11.85%) Rational DOORS
19 167 (11.18%) Computer Science
20 165 (11.04%) Mathematics
20 165 (11.04%) IBM
21 164 (10.98%) Validation
22 163 (10.91%) Signal Processing
23 156 (10.44%) Artificial Intelligence
23 156 (10.44%) Roadmaps
24 153 (10.24%) AWS
25 133 (8.90%) SQL
26 131 (8.77%) Data Science
27 128 (8.57%) Machine Learning

Senior Skill Set
Co-occurring Skills and Capabilities in the South East by Category

The follow tables expand on the table above by listing co-occurrences grouped by category. The same employment type, locality and period is covered with up to 20 co-occurrences shown in each of the following categories:

Application Platforms
1 22 (1.47%) SharePoint
2 10 (0.67%) IIS
3 9 (0.60%) Microsoft Exchange
4 5 (0.33%) CMS
4 5 (0.33%) Confluence
5 4 (0.27%) Apache Spark
6 3 (0.20%) Umbraco
7 2 (0.13%) Apache Solr
7 2 (0.13%) nginx
8 1 (0.067%) Apache
8 1 (0.067%) Headless CMS
8 1 (0.067%) Strapi
Applications
1 100 (6.69%) Simulink
2 76 (5.09%) Mathcad
3 30 (2.01%) Microsoft Office
4 12 (0.80%) Microsoft Excel
5 5 (0.33%) AutoCAD
6 4 (0.27%) Revit
7 1 (0.067%) CATIA
7 1 (0.067%) Chatbot
7 1 (0.067%) Microsoft PowerPoint
7 1 (0.067%) MicroStation
7 1 (0.067%) Spreadsheet
Business Applications
1 16 (1.07%) OpenText VIM for SAP
1 16 (1.07%) SAP FI
2 9 (0.60%) SAP BPC
3 8 (0.54%) Infor LN
4 6 (0.40%) Dynamics CRM
5 4 (0.27%) Dynamics NAV
6 3 (0.20%) Oracle ERP
6 3 (0.20%) SAP GRC
7 2 (0.13%) Maximo
7 2 (0.13%) Salesforce CRM
7 2 (0.13%) SAP S/4HANA
8 1 (0.067%) Adobe Campaign
8 1 (0.067%) Shopify
8 1 (0.067%) Sparx Enterprise Architect
8 1 (0.067%) Teamcenter
Cloud Services
1 231 (15.46%) Azure
2 153 (10.24%) AWS
3 99 (6.63%) GCP
4 56 (3.75%) Serverless
5 43 (2.88%) AWS Lambda
6 42 (2.81%) Microsoft 365
7 32 (2.14%) Azure Synapse Analytics
8 30 (2.01%) SaaS
9 28 (1.87%) Snowflake
10 25 (1.67%) Azure Data Factory
11 23 (1.54%) Power Platform
12 21 (1.41%) Vertex AI
13 20 (1.34%) Azure Monitor
14 18 (1.20%) Azure DevOps
15 16 (1.07%) Entra ID
15 16 (1.07%) GitHub
16 14 (0.94%) Salsify
17 12 (0.80%) Amazon S3
17 12 (0.80%) Cloudflare
18 10 (0.67%) Virtual Private Cloud
Communications & Networking
1 70 (4.69%) Broadband
2 40 (2.68%) Firewall
3 29 (1.94%) VPN
4 20 (1.34%) DNS
5 13 (0.87%) TCP/IP
6 11 (0.74%) VoIP
7 10 (0.67%) DHCP
8 9 (0.60%) BGP
8 9 (0.60%) WAN
9 8 (0.54%) Network Security
9 8 (0.54%) VLAN
10 6 (0.40%) HTTPS
10 6 (0.40%) IPsec
10 6 (0.40%) LAN
10 6 (0.40%) MPLS
10 6 (0.40%) OSPF
10 6 (0.40%) Remote Desktop
11 5 (0.33%) HTTP
11 5 (0.33%) iSCSI
11 5 (0.33%) SAN
Database & Business Intelligence
1 66 (4.42%) Data Lake
2 57 (3.82%) SQL Server
3 41 (2.74%) Metadata
4 35 (2.34%) Data Warehouse
5 31 (2.07%) Data Mining
5 31 (2.07%) MySQL
6 26 (1.74%) OLTP
7 20 (1.34%) Big Data
7 20 (1.34%) Power BI
8 19 (1.27%) Elasticsearch
9 17 (1.14%) DynamoDB
10 12 (0.80%) PostgreSQL
10 12 (0.80%) Tableau
11 11 (0.74%) MongoDB
12 7 (0.47%) Azure SQL Database
13 5 (0.33%) Amazon RDS
13 5 (0.33%) Microsoft Analysis Services
13 5 (0.33%) NoSQL
13 5 (0.33%) Relational Database
14 4 (0.27%) Metabase
Development Applications
1 177 (11.85%) Rational DOORS
2 60 (4.02%) Git
3 24 (1.61%) JIRA
4 14 (0.94%) Jenkins
4 14 (0.94%) MagicDraw
5 11 (0.74%) NUnit
5 11 (0.74%) TeamCity
6 10 (0.67%) Jasmine
7 8 (0.54%) Oracle Forms
7 8 (0.54%) Subversion
8 7 (0.47%) rollup.js
9 5 (0.33%) Selenium
9 5 (0.33%) SpecFlow
10 4 (0.27%) Babel
10 4 (0.27%) Bitbucket
10 4 (0.27%) Cypress.io
10 4 (0.27%) Visual Studio
10 4 (0.27%) webpack
11 3 (0.20%) Mocha
11 3 (0.20%) Vite
General
1 361 (24.16%) Social Skills
2 231 (15.46%) Electronics
3 227 (15.19%) Law
4 209 (13.99%) Analytical Skills
5 178 (11.91%) Finance
6 95 (6.36%) Inclusion and Diversity
7 81 (5.42%) Legal
8 77 (5.15%) Influencing Skills
9 72 (4.82%) Marketing
10 62 (4.15%) Manufacturing
11 53 (3.55%) Retail
12 51 (3.41%) Games
13 30 (2.01%) Advertising
14 25 (1.67%) Aerospace
15 23 (1.54%) Military
16 21 (1.41%) Automotive
17 19 (1.27%) Telecoms
18 15 (1.00%) Banking
19 13 (0.87%) Pharmaceutical
20 11 (0.74%) Public Sector
Libraries, Frameworks & Software Standards
1 93 (6.22%) .NET
2 83 (5.56%) React
3 65 (4.35%) HTML
4 52 (3.48%) GraphQL
5 45 (3.01%) Node.js
6 39 (2.61%) ASP.NET
7 35 (2.34%) CSS
8 33 (2.21%) AngularJS
9 31 (2.07%) RESTful
10 30 (2.01%) XML
11 26 (1.74%) WebGL
12 25 (1.67%) .NET Core
12 25 (1.67%) Unity (Game Engine)
13 20 (1.34%) HTML5
13 20 (1.34%) REST
14 19 (1.27%) JSON
15 18 (1.20%) Jest
15 18 (1.20%) Vue
16 17 (1.14%) SOAP
17 16 (1.07%) Blazor
Miscellaneous
1 204 (13.65%) Algorithms
2 84 (5.62%) Management Information System
3 60 (4.02%) Self-Motivation
4 46 (3.08%) Analytical Mindset
5 26 (1.74%) Animation
6 22 (1.47%) Product Ownership
7 17 (1.14%) Acoustics
8 15 (1.00%) Data Centre
8 15 (1.00%) Digital Media
8 15 (1.00%) Marketing Technology
8 15 (1.00%) Onboarding
9 14 (0.94%) Greenfield Project
9 14 (0.94%) Mobile App
9 14 (0.94%) Taxonomies
10 11 (0.74%) Video\Live Streaming
11 10 (0.67%) Driving Licence
12 9 (0.60%) CCTV
12 9 (0.60%) Cloud Native
12 9 (0.60%) VHDL
13 8 (0.54%) Social Media
Operating Systems
1 39 (2.61%) Linux
2 34 (2.28%) Windows
3 12 (0.80%) Apple iOS
4 10 (0.67%) Android
5 9 (0.60%) Mac OS
6 8 (0.54%) Red Hat Enterprise Linux
7 7 (0.47%) Unix
7 7 (0.47%) Windows Server
8 5 (0.33%) Windows Server 2019
9 3 (0.20%) Windows 10
9 3 (0.20%) Windows Server 2016
10 1 (0.067%) CentOS
10 1 (0.067%) Debian
10 1 (0.067%) VMS
Processes & Methodologies
1 384 (25.70%) Problem-Solving
2 368 (24.63%) Systems Engineering
3 314 (21.02%) Agile
4 272 (18.21%) Mentoring
5 202 (13.52%) Technical Leadership
6 182 (12.18%) Analytics
7 167 (11.18%) Computer Science
8 165 (11.04%) Mathematics
9 164 (10.98%) Validation
10 163 (10.91%) Signal Processing
11 156 (10.44%) Artificial Intelligence
11 156 (10.44%) Roadmaps
12 131 (8.77%) Data Science
13 128 (8.57%) Machine Learning
14 127 (8.50%) Software Engineering
14 127 (8.50%) Verification and Validation
15 118 (7.90%) Project Management
16 115 (7.70%) Stakeholder Engagement
17 111 (7.43%) Software Testing
18 109 (7.30%) CI/CD
Programming Languages
1 241 (16.13%) Python
2 133 (8.90%) SQL
3 113 (7.56%) C#
4 102 (6.83%) MATLAB
5 92 (6.16%) TypeScript
6 88 (5.89%) JavaScript
7 87 (5.82%) R
8 58 (3.88%) Java
9 53 (3.55%) C++
10 38 (2.54%) Ada
11 37 (2.48%) C
12 26 (1.74%) PL/SQL
13 25 (1.67%) HLSL
14 22 (1.47%) PowerShell
15 19 (1.27%) Bash
16 18 (1.20%) PHP
17 11 (0.74%) Rust
18 10 (0.67%) Bicep
18 10 (0.67%) Data Analysis Expressions
19 6 (0.40%) Objective-C
Qualifications
1 557 (37.28%) Degree
2 517 (34.61%) BPSS Clearance
3 58 (3.88%) Master's Degree
4 51 (3.41%) Security Cleared
5 40 (2.68%) Computer Science Degree
6 32 (2.14%) PhD
7 30 (2.01%) CISSP
8 29 (1.94%) Chartered Engineer
9 26 (1.74%) SC Cleared
10 23 (1.54%) Azure Certification
10 23 (1.54%) DV Cleared
11 20 (1.34%) DBS Check
12 19 (1.27%) Microsoft Certification
13 12 (0.80%) Cisco Certification
14 11 (0.74%) Numerate Degree
15 10 (0.67%) ACCA
15 10 (0.67%) CCNP
15 10 (0.67%) HND
16 9 (0.60%) CIMA
17 7 (0.47%) AWS Certification
Quality Assurance & Compliance
1 240 (16.06%) ISO/IEC 15288
2 82 (5.49%) IEC 61508
3 71 (4.75%) QA
4 55 (3.68%) Data Quality
5 48 (3.21%) ISO/IEC 12207
6 47 (3.15%) Def Stans
7 36 (2.41%) Accessibility
8 35 (2.34%) ARP4754
8 35 (2.34%) DO-254
9 28 (1.87%) HAZOP
10 18 (1.20%) GDPR
11 15 (1.00%) ISO/IEC 27001
12 8 (0.54%) GAAP
12 8 (0.54%) IFRS
13 7 (0.47%) Sarbanes-Oxley
14 4 (0.27%) GMP
15 3 (0.20%) GRC
15 3 (0.20%) SLA
16 2 (0.13%) COSHH
16 2 (0.13%) Cyber Essentials
System Software
1 32 (2.14%) Active Directory
2 30 (2.01%) Docker
3 16 (1.07%) Firmware
4 11 (0.74%) Virtual Machines
5 10 (0.67%) VMware Infrastructure
6 7 (0.47%) VMware ESXi
7 6 (0.40%) Embedded Firmware
7 6 (0.40%) Virtual Desktop
8 4 (0.27%) Citrix Hypervisor
8 4 (0.27%) Hyper-V
9 2 (0.13%) VMware NSX
10 1 (0.067%) HDFS
10 1 (0.067%) IAG
10 1 (0.067%) KVM
10 1 (0.067%) NFS
10 1 (0.067%) Terminal Server
Systems Management
1 44 (2.95%) Kubernetes
2 36 (2.41%) Terraform
3 31 (2.07%) Functional Safety
4 16 (1.07%) Ansible
5 15 (1.00%) Grafana
5 15 (1.00%) Prometheus
6 9 (0.60%) Microsoft Intune
7 4 (0.27%) FortiGate
8 2 (0.13%) EnCase
8 2 (0.13%) FTK
8 2 (0.13%) RSA Security Analytics
8 2 (0.13%) SCCM
9 1 (0.067%) Active Directory Federation Services
9 1 (0.067%) EMC NetWorker
9 1 (0.067%) Kubeflow
9 1 (0.067%) Packer
9 1 (0.067%) SCOM
9 1 (0.067%) Single Sign-On
9 1 (0.067%) vCenter Server
Vendors
1 181 (12.12%) Microsoft
2 165 (11.04%) IBM
3 77 (5.15%) MathWorks
4 45 (3.01%) Oracle
5 40 (2.68%) Databricks
6 34 (2.28%) OpenAI
7 30 (2.01%) SAP
8 28 (1.87%) Google
9 25 (1.67%) Cisco
10 19 (1.27%) Salesforce
11 18 (1.20%) Splunk
12 17 (1.14%) Siemens
12 17 (1.14%) VMware
13 15 (1.00%) Apple
13 15 (1.00%) Dell
14 12 (0.80%) Juniper
14 12 (0.80%) Rollbar
15 10 (0.67%) ServiceNow
16 8 (0.54%) Atlassian
16 8 (0.54%) Infor