SharePoint Jobs in Berkshire

Microsoft SharePoint
South East > Berkshire

The following table provides summary statistics for permanent job vacancies advertised in Berkshire with a requirement for SharePoint skills. Included is a benchmarking guide to the salaries offered in vacancies that have cited SharePoint over the 6 months to 27 April 2024 with a comparison to the same period in the previous 2 years.

6 months to
27 Apr 2024
Same period 2023 Same period 2022
Rank 77 102 77
Rank change year-on-year +25 -25 +18
Permanent jobs citing SharePoint 87 87 118
As % of all permanent jobs advertised in Berkshire 2.82% 2.73% 3.47%
As % of the Application Platforms category 25.07% 25.74% 27.70%
Number of salaries quoted 62 50 57
10th Percentile £25,500 £30,500 £27,300
25th Percentile £38,151 £35,427 £40,000
Median annual salary (50th Percentile) £42,500 £46,350 £50,500
Median % change year-on-year -8.31% -8.22% +26.25%
75th Percentile £52,500 £60,000 £65,000
90th Percentile £58,500 £65,250 £72,000
South East median annual salary £42,500 £40,000 £43,500
% change year-on-year +6.25% -8.05% +2.35%

All Application Platform Skills
Berkshire

SharePoint is in the Application Platforms category. The following table is for comparison with the above and provides summary statistics for all permanent job vacancies advertised in Berkshire with a requirement for application platform skills.

Permanent vacancies with a requirement for application platform skills 347 338 426
As % of all permanent jobs advertised in Berkshire 11.26% 10.63% 12.51%
Number of salaries quoted 207 165 253
10th Percentile £30,750 £27,500 £29,125
25th Percentile £37,500 £36,750 £40,000
Median annual salary (50th Percentile) £52,500 £50,000 £51,350
Median % change year-on-year +5.00% -2.63% -2.19%
75th Percentile £63,750 £67,500 £68,750
90th Percentile £76,000 £85,000 £77,500
South East median annual salary £42,500 £50,000 £47,201
% change year-on-year -15.00% +5.93% +4.89%

SharePoint
Job Vacancy Trend in Berkshire

Job postings citing SharePoint as a proportion of all IT jobs advertised in Berkshire.
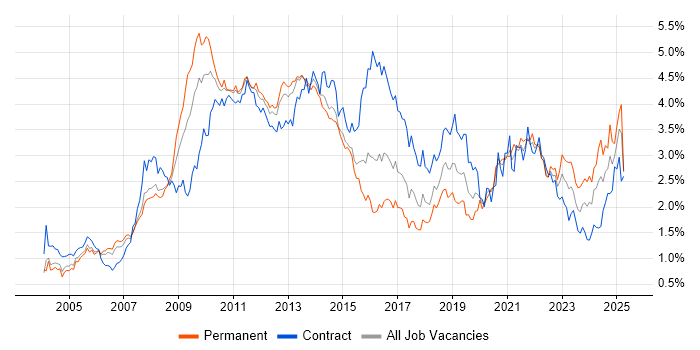
Job vacancy trend for SharePoint in Berkshire

SharePoint
Salary Trend in Berkshire

3-month moving average salary quoted in jobs citing SharePoint in Berkshire.

Salary trend for SharePoint in Berkshire

SharePoint
Salary Histogram in Berkshire

Salary distribution for jobs citing SharePoint in Berkshire over the 6 months to 27 April 2024.

Salary histogram for SharePoint in Berkshire

SharePoint
Job Locations in Berkshire

The table below looks at the demand and provides a guide to the median salaries quoted in IT jobs citing SharePoint within the Berkshire region over the 6 months to 27 April 2024. The 'Rank Change' column provides an indication of the change in demand within each location based on the same 6 month period last year.

Location Rank Change
on Same Period
Last Year
Matching
Permanent
IT Job Ads
Median Salary
Past 6 Months
Median Salary
% Change
on Same Period
Last Year
Live
Jobs
Reading -4 36 £43,500 -13.00% 5
Ascot - 8 £42,500 -
Maidenhead - 8 - - 2
Bracknell +3 6 £42,500 +37.10% 2
Slough +33 5 £52,500 +75.00%
Newbury -2 2 - - 1
Wokingham - 1 £70,000 -
SharePoint
South East

SharePoint
Co-occurring Skills and Capabilities in Berkshire by Category

The follow tables expand on the table above by listing co-occurrences grouped by category. The same employment type, locality and period is covered with up to 20 co-occurrences shown in each of the following categories:

Application Platforms
1 23 (26.44%) Microsoft Exchange
2 8 (9.20%) WordPress
3 7 (8.05%) CMS
4 4 (4.60%) Drupal
4 4 (4.60%) IIS
5 3 (3.45%) Alfresco
5 3 (3.45%) Documentum
5 3 (3.45%) FileNet
Applications
1 20 (22.99%) Microsoft Office
2 10 (11.49%) Microsoft Excel
3 9 (10.34%) Microsoft PowerPoint
3 9 (10.34%) MS Visio
4 4 (4.60%) Microsoft Project
5 3 (3.45%) Photoshop
6 2 (2.30%) Adobe Premiere
7 1 (1.15%) Adobe Illustrator
Business Applications
1 5 (5.75%) Sage X3
2 1 (1.15%) Dynamics CRM
Cloud Services
1 66 (75.86%) Microsoft 365
2 32 (36.78%) Power Platform
3 24 (27.59%) OneDrive
4 17 (19.54%) Power Automate
5 16 (18.39%) Azure
5 16 (18.39%) PowerApps
6 12 (13.79%) iTunes
7 9 (10.34%) ShareGate
8 3 (3.45%) AWS
8 3 (3.45%) Cloud Computing
8 3 (3.45%) Dropbox
8 3 (3.45%) Entra ID
8 3 (3.45%) Microsoft Purview
8 3 (3.45%) SaaS
9 1 (1.15%) Azure Functions
9 1 (1.15%) Azure WebJobs
9 1 (1.15%) Dynamics 365
9 1 (1.15%) Serverless
9 1 (1.15%) Yammer
Communications & Networking
1 17 (19.54%) Firewall
2 15 (17.24%) SSL
3 12 (13.79%) Network Security
4 8 (9.20%) VLAN
5 4 (4.60%) DNS
5 4 (4.60%) Fibre Channel
5 4 (4.60%) iSCSI
5 4 (4.60%) NAS
5 4 (4.60%) SAN
5 4 (4.60%) VPN
5 4 (4.60%) Wireless
6 1 (1.15%) VoIP
Database & Business Intelligence
1 16 (18.39%) Power BI
2 13 (14.94%) SQL Server
3 4 (4.60%) Power Query
4 2 (2.30%) Oracle BI EE
4 2 (2.30%) SQL Server Analysis Services
4 2 (2.30%) SQL Server Integration Services
4 2 (2.30%) SQL Server Reporting Services
4 2 (2.30%) SSDT
4 2 (2.30%) Star Schema
Development Applications
1 1 (1.15%) Visual Studio
1 1 (1.15%) Visual Studio Code
General
1 25 (28.74%) Social Skills
2 10 (11.49%) Fire and Rescue
2 10 (11.49%) Local Government
3 9 (10.34%) Inclusion and Diversity
3 9 (10.34%) Pharmaceutical
4 7 (8.05%) Marketing
5 4 (4.60%) Finance
5 4 (4.60%) Publishing
5 4 (4.60%) Telecoms
6 2 (2.30%) Legal
6 2 (2.30%) Manufacturing
7 1 (1.15%) Analytical Skills
7 1 (1.15%) Documentation Skills
7 1 (1.15%) Organisational Skills
Job Titles
1 23 (26.44%) IT Engineer
2 17 (19.54%) IT Support
3 16 (18.39%) IT Support Engineer
3 16 (18.39%) Support Engineer
4 12 (13.79%) Project Engineer
5 10 (11.49%) Developer
5 10 (11.49%) Microsoft 365 Specialist
5 10 (11.49%) Microsoft Specialist
5 10 (11.49%) Process Improvement Specialist
6 9 (10.34%) Associate Director
7 6 (6.90%) SharePoint Developer
8 5 (5.75%) Analyst
8 5 (5.75%) Communications Manager
8 5 (5.75%) Project Support Engineer
9 4 (4.60%) Azure Engineer
9 4 (4.60%) Digital Transformation
9 4 (4.60%) Digital Transformation Manager
9 4 (4.60%) Digital Transformation Project Manager
9 4 (4.60%) Power BI Developer
9 4 (4.60%) Transformation Manager
Libraries, Frameworks & Software Standards
1 8 (9.20%) .NET
1 8 (9.20%) SPFx
2 4 (4.60%) LAMP
2 4 (4.60%) React
3 2 (2.30%) REST
3 2 (2.30%) XML
4 1 (1.15%) .NET Framework
4 1 (1.15%) AngularJS
4 1 (1.15%) ASP.NET
4 1 (1.15%) Flash
4 1 (1.15%) HTML
4 1 (1.15%) jQuery
4 1 (1.15%) Kafka
4 1 (1.15%) WinForms
Miscellaneous
1 5 (5.75%) Social Media
2 4 (4.60%) Blog
2 4 (4.60%) Linux Command Line
2 4 (4.60%) Replication
2 4 (4.60%) Self-Motivation
3 3 (3.45%) Video Editing
4 2 (2.30%) Management Information System
4 2 (2.30%) Photography
5 1 (1.15%) Product Ownership
5 1 (1.15%) Tandem
Operating Systems
1 9 (10.34%) Android
2 6 (6.90%) Windows
3 4 (4.60%) Linux
3 4 (4.60%) Ubuntu
3 4 (4.60%) VMS
3 4 (4.60%) Windows Server
3 4 (4.60%) Windows Server 2016
3 4 (4.60%) Windows Server 2019
4 1 (1.15%) Apple iOS
Processes & Methodologies
1 19 (21.84%) Project Management
2 17 (19.54%) Project Delivery
3 15 (17.24%) Agile
3 15 (17.24%) Data Integration
4 14 (16.09%) Business Intelligence
4 14 (16.09%) Content Management
4 14 (16.09%) DevOps
4 14 (16.09%) Roadmaps
5 13 (14.94%) SDLC
6 12 (13.79%) Project Planning
7 11 (12.64%) Stakeholder Management
8 10 (11.49%) Business Process Improvement
8 10 (11.49%) Change Control
8 10 (11.49%) Continuous Improvement
8 10 (11.49%) Process Improvement
8 10 (11.49%) Strategic Thinking
9 9 (10.34%) Contract Management
9 9 (10.34%) Contract Negotiation
9 9 (10.34%) Product Roadmap
9 9 (10.34%) Technology Roadmap
Programming Languages
1 24 (27.59%) SQL
2 7 (8.05%) PowerShell
3 6 (6.90%) C#
4 5 (5.75%) Java
5 2 (2.30%) T-SQL
6 1 (1.15%) JavaScript
6 1 (1.15%) TypeScript
6 1 (1.15%) VB
Qualifications
1 17 (19.54%) Degree
2 10 (11.49%) DBS Check
3 9 (10.34%) ITIL Certification
3 9 (10.34%) Master's Degree
4 1 (1.15%) SC Cleared
4 1 (1.15%) Security Cleared
Quality Assurance & Compliance
1 1 (1.15%) PMO
1 1 (1.15%) QA
System Software
1 29 (33.33%) Active Directory
2 4 (4.60%) vSphere
Systems Management
1 4 (4.60%) Microsoft Intune
1 4 (4.60%) SCCM
Vendors
1 72 (82.76%) Microsoft
2 9 (10.34%) Nintex
3 8 (9.20%) Apple
3 8 (9.20%) Barracuda Networks
4 5 (5.75%) Sage
5 4 (4.60%) Aruba
5 4 (4.60%) Palo Alto
5 4 (4.60%) ProCurve
5 4 (4.60%) Synology
5 4 (4.60%) Veeam
5 4 (4.60%) VMware
5 4 (4.60%) Zerto
6 3 (3.45%) EMC
6 3 (3.45%) Hyland
6 3 (3.45%) IBM
6 3 (3.45%) iManage
6 3 (3.45%) Laserfiche
6 3 (3.45%) OpenText
6 3 (3.45%) Oracle
6 3 (3.45%) Salesforce