User Acceptance Testing Jobs in Birmingham

User Acceptance Testing (UAT)
West Midlands > Birmingham

The following table provides summary statistics for permanent job vacancies advertised in Birmingham with a requirement for User Acceptance Testing skills. Included is a benchmarking guide to the salaries offered in vacancies that have cited User Acceptance Testing over the 6 months to 28 April 2024 with a comparison to the same period in the previous 2 years.

6 months to
28 Apr 2024
Same period 2023 Same period 2022
Rank 99 126 143
Rank change year-on-year +27 +17 -31
Permanent jobs citing User Acceptance Testing 49 17 55
As % of all permanent jobs advertised in Birmingham 1.81% 0.85% 1.75%
As % of the Processes & Methodologies category 2.19% 0.89% 1.80%
Number of salaries quoted 43 13 54
10th Percentile - £42,500 £26,750
25th Percentile £47,500 £51,250 £37,031
Median annual salary (50th Percentile) £52,500 £55,000 £44,275
Median % change year-on-year -4.55% +24.22% -1.61%
75th Percentile £62,500 £70,000 £55,313
90th Percentile £74,500 - £60,000
West Midlands median annual salary £57,500 £52,500 £42,500
% change year-on-year +9.52% +23.53% -5.56%

All Process and Methodology Skills
Birmingham

User Acceptance Testing is in the Processes and Methodologies category. The following table is for comparison with the above and provides summary statistics for all permanent job vacancies advertised in Birmingham with a requirement for process or methodology skills.

Permanent vacancies with a requirement for process or methodology skills 2,239 1,918 3,064
As % of all permanent jobs advertised in Birmingham 82.59% 95.80% 97.77%
Number of salaries quoted 1,810 1,410 2,320
10th Percentile £32,000 £31,250 £34,000
25th Percentile £41,250 £43,089 £42,500
Median annual salary (50th Percentile) £55,000 £55,750 £55,000
Median % change year-on-year -1.35% +1.36% +10.00%
75th Percentile £69,886 £71,250 £71,250
90th Percentile £84,967 £82,751 £85,000
West Midlands median annual salary £50,000 £53,000 £50,000
% change year-on-year -5.66% +6.00% +5.26%

User Acceptance Testing
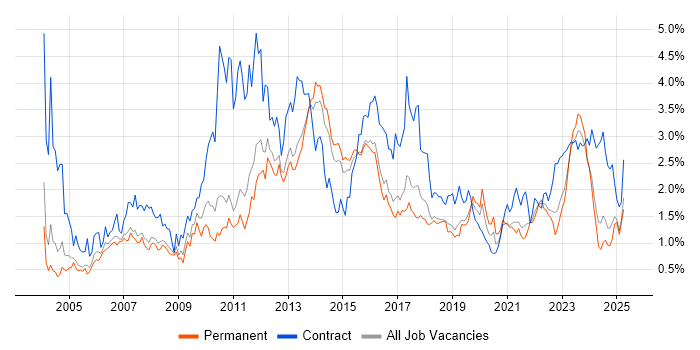
Job Vacancy Trend in Birmingham

Job postings citing User Acceptance Testing as a proportion of all IT jobs advertised in Birmingham.

Job vacancy trend for User Acceptance Testing in Birmingham

User Acceptance Testing
Salary Trend in Birmingham

3-month moving average salary quoted in jobs citing User Acceptance Testing in Birmingham.

Salary trend for User Acceptance Testing in Birmingham

User Acceptance Testing
Salary Histogram in Birmingham

Salary distribution for jobs citing User Acceptance Testing in Birmingham over the 6 months to 28 April 2024.

Salary histogram for User Acceptance Testing in Birmingham

User Acceptance Testing
Co-occurring Skills and Capabilities in Birmingham by Category

The follow tables expand on the table above by listing co-occurrences grouped by category. The same employment type, locality and period is covered with up to 20 co-occurrences shown in each of the following categories:

Application Platforms
1 5 (10.20%) IIS
2 3 (6.12%) Confluence
3 2 (4.08%) Microsoft Exchange
3 2 (4.08%) SharePoint
Applications
1 2 (4.08%) Microsoft Office
Business Applications
1 14 (28.57%) NetSuite
2 2 (4.08%) Dynamics CRM
2 2 (4.08%) Dynamics NAV
3 1 (2.04%) Oracle EBS
Cloud Services
1 13 (26.53%) Azure
2 10 (20.41%) Dynamics 365
3 9 (18.37%) Azure DevOps
4 5 (10.20%) Microsoft 365
5 2 (4.08%) Azure Data Factory
5 2 (4.08%) Azure Logic Apps
5 2 (4.08%) Power Platform
5 2 (4.08%) PowerApps
Database & Business Intelligence
1 7 (14.29%) SQL Server
2 2 (4.08%) Data Lake
2 2 (4.08%) Data Warehouse
2 2 (4.08%) Power BI
3 1 (2.04%) Oracle Reports
Development Applications
1 5 (10.20%) Jasmine
1 5 (10.20%) Karma Test Runner
2 3 (6.12%) JIRA
General
1 32 (65.31%) Social Skills
2 23 (46.94%) Finance
3 6 (12.24%) Billing
3 6 (12.24%) Presentation Skills
3 6 (12.24%) Retail
4 5 (10.20%) Back Office
5 3 (6.12%) Inclusion and Diversity
5 3 (6.12%) Law
6 2 (4.08%) General Ledger
6 2 (4.08%) Manufacturing
6 2 (4.08%) Marketing
7 1 (2.04%) Pharmaceutical
7 1 (2.04%) Public Sector
Job Titles
1 21 (42.86%) Consultant
2 20 (40.82%) Senior
3 16 (32.65%) Functional Consultant
3 16 (32.65%) Senior Consultant
4 15 (30.61%) Senior Functional Consultant
5 14 (28.57%) NetSuite Consultant
6 8 (16.33%) Project Manager
7 5 (10.20%) C# Developer
7 5 (10.20%) Developer
7 5 (10.20%) Dynamics 365 Consultant
7 5 (10.20%) Product Owner
8 3 (6.12%) Lead
8 3 (6.12%) Product Manager
8 3 (6.12%) Senior Manager
8 3 (6.12%) Senior Product Manager
9 2 (4.08%) CRM Consultant
9 2 (4.08%) Dynamics CRM Consultant
9 2 (4.08%) Microsoft Consultant
9 2 (4.08%) Software Manager
9 2 (4.08%) Software Project Manager
Libraries, Frameworks & Software Standards
1 7 (14.29%) .NET
1 7 (14.29%) SOAP
2 5 (10.20%) AngularJS
2 5 (10.20%) ASP.NET
2 5 (10.20%) JSON
2 5 (10.20%) REST
2 5 (10.20%) RxJS
2 5 (10.20%) Sass
2 5 (10.20%) Web Services
2 5 (10.20%) XML
2 5 (10.20%) XML Schema
3 2 (4.08%) RESTful
Miscellaneous
1 14 (28.57%) Legacy Systems
2 9 (18.37%) Product Ownership
3 2 (4.08%) Greenfield Project
3 2 (4.08%) Virtual Team
4 1 (2.04%) FMCG
4 1 (2.04%) Replication
Processes & Methodologies
1 17 (34.69%) Process Improvement
2 16 (32.65%) Data Migration
2 16 (32.65%) Migration
2 16 (32.65%) Problem-Solving
2 16 (32.65%) Procure-to-Pay
3 14 (28.57%) Order to Cash
3 14 (28.57%) Record to Report
4 13 (26.53%) Customer Service
4 13 (26.53%) Project Management
5 11 (22.45%) Agile
6 9 (18.37%) DevOps
6 9 (18.37%) Project Delivery
7 8 (16.33%) CRM
7 8 (16.33%) Roadmaps
7 8 (16.33%) Stakeholder Management
8 7 (14.29%) Customer-Centricity
9 6 (12.24%) Conflict Resolution
9 6 (12.24%) Resource Allocation
9 6 (12.24%) Risk Register
9 6 (12.24%) Software Delivery
Programming Languages
1 9 (18.37%) SQL
2 7 (14.29%) JavaScript
3 5 (10.20%) C#
3 5 (10.20%) T-SQL
3 5 (10.20%) TypeScript
3 5 (10.20%) VB
3 5 (10.20%) VB.NET
3 5 (10.20%) VB6
4 2 (4.08%) Python
Qualifications
1 10 (20.41%) Degree
2 3 (6.12%) CSPO
2 3 (6.12%) IIBA
3 2 (4.08%) ISTQB
3 2 (4.08%) SC Cleared
3 2 (4.08%) Security Cleared
Quality Assurance & Compliance
1 9 (18.37%) QA
2 2 (4.08%) Data Quality
Vendors
1 12 (24.49%) Microsoft
2 5 (10.20%) Genesys
2 5 (10.20%) YouTube
3 3 (6.12%) Salesforce
3 3 (6.12%) ServiceNow
4 2 (4.08%) Databricks
4 2 (4.08%) SAP
5 1 (2.04%) Oracle