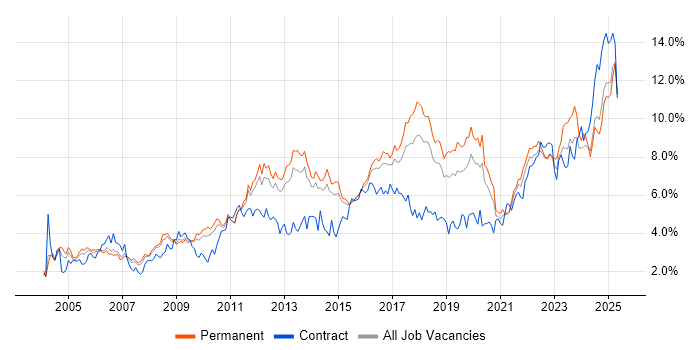
Analytical Skills Job Trends in Birmingham

Analytical Skills
West Midlands > Birmingham

The table below looks at the prevalence of the term Analytical Skills in permanent job vacancies in Birmingham. Included is a benchmarking guide to the salaries offered in vacancies that cited Analytical Skills over the 6 months leading up to 16 September 2025, comparing them to the same period in the previous two years.

6 months to
16 Sep 2025
Same period 2024 Same period 2023
Rank 10 16 17
Rank change year-on-year +6 +1 +12
Permanent jobs citing Analytical Skills 151 178 137
As % of all permanent jobs advertised in Birmingham 12.71% 7.77% 9.65%
As % of the General category 20.16% 14.35% 14.64%
Number of salaries quoted 86 72 122
10th Percentile £27,875 £34,900 £30,813
25th Percentile £33,125 £45,875 £41,250
Median annual salary (50th Percentile) £52,500 £50,750 £60,500
Median % change year-on-year +3.45% -16.12% +10.00%
75th Percentile £72,813 £67,500 £69,375
90th Percentile £75,000 £84,964 £77,500
West Midlands median annual salary £45,000 £47,500 £52,150
% change year-on-year -5.26% -8.92% +10.96%

All General Skills
Birmingham

Analytical Skills falls under the General Skills category. For comparison with the information above, the following table provides summary statistics for all permanent job vacancies requiring common skills in Birmingham.

Permanent vacancies with a requirement for common skills 749 1,240 936
As % of all permanent jobs advertised in Birmingham 63.05% 54.12% 65.92%
Number of salaries quoted 469 619 780
10th Percentile £31,750 £31,250 £31,250
25th Percentile £41,250 £40,000 £41,250
Median annual salary (50th Percentile) £55,000 £55,000 £55,000
75th Percentile £72,500 £69,960 £70,000
90th Percentile £82,292 £88,750 £81,250
West Midlands median annual salary £47,500 £50,000 £50,000
% change year-on-year -5.00% - +4.17%

Analytical Skills
Job Vacancy Trend in Birmingham

Job postings citing Analytical Skills as a proportion of all IT jobs advertised in Birmingham.

Job vacancy trend for Analytical Skills in Birmingham

Analytical Skills
Salary Trend in Birmingham

Salary distribution trend for jobs in Birmingham citing Analytical Skills.

Salary distribution trend for jobs in Birmingham citing Analytical Skills

Analytical Skills
Salary Histogram in Birmingham

Salary distribution for jobs citing Analytical Skills in Birmingham over the 6 months to 16 September 2025.

Salary histogram for Analytical Skills in Birmingham

Analytical Skills
Co-occurring Skills and Capabilities in Birmingham by Category

The follow tables expand on the table above by listing co-occurrences grouped by category. The same employment type, locality and period is covered with up to 20 co-occurrences shown in each of the following categories:

Applications
1 38 (25.17%) Chatbot
2 3 (1.99%) Microsoft Excel
3 2 (1.32%) Spreadsheet
4 1 (0.66%) MS Visio
Business Applications
1 13 (8.61%) SAP S/4HANA
2 11 (7.28%) NetSuite
3 5 (3.31%) Dynamics NAV
4 1 (0.66%) Dynamics CRM
4 1 (0.66%) iTrent
4 1 (0.66%) Pegasus Opera
4 1 (0.66%) SAP ERP
4 1 (0.66%) SAP HCM
4 1 (0.66%) SAP Payroll
Cloud Services
1 7 (4.64%) Dynamics 365
2 6 (3.97%) Azure
2 6 (3.97%) SaaS
3 5 (3.31%) Power Platform
4 4 (2.65%) AWS
5 2 (1.32%) Azure Data Factory
5 2 (1.32%) GCP
5 2 (1.32%) Microsoft 365
6 1 (0.66%) Azure Synapse Analytics
6 1 (0.66%) GitHub
6 1 (0.66%) GitHub Actions
6 1 (0.66%) Google Ads
6 1 (0.66%) Google Analytics
6 1 (0.66%) Lucidchart
6 1 (0.66%) Snowflake
6 1 (0.66%) SuccessFactors
Communications & Networking
1 3 (1.99%) Intrusion Detection
2 2 (1.32%) Firewall
2 2 (1.32%) Network Security
2 2 (1.32%) SMS
3 1 (0.66%) BGP
3 1 (0.66%) Cisco Nexus
3 1 (0.66%) HTTP
3 1 (0.66%) OSPF
3 1 (0.66%) SAN
3 1 (0.66%) SD-WAN
3 1 (0.66%) VPN
3 1 (0.66%) WAN
Database & Business Intelligence
1 5 (3.31%) Power BI
2 4 (2.65%) Data Warehouse
2 4 (2.65%) SQL Server
3 3 (1.99%) Azure SQL Database
3 3 (1.99%) Hazelcast
3 3 (1.99%) Tableau
4 2 (1.32%) Azure SQL Data Warehouse
4 2 (1.32%) PostgreSQL
5 1 (0.66%) Big Data
5 1 (0.66%) BusinessObjects
5 1 (0.66%) Data Mining
5 1 (0.66%) Hadoop
5 1 (0.66%) Looker
5 1 (0.66%) Metadata
5 1 (0.66%) MongoDB
5 1 (0.66%) NoSQL
Development Applications
1 3 (1.99%) GitLab
1 3 (1.99%) JIRA
2 2 (1.32%) Selenium
3 1 (0.66%) ER Studio
3 1 (0.66%) ERwin
3 1 (0.66%) PowerDesigner
3 1 (0.66%) Sonatype Nexus
General
1 65 (43.05%) Social Skills
2 41 (27.15%) Finance
3 8 (5.30%) Inclusion and Diversity
3 8 (5.30%) Law
3 8 (5.30%) Organisational Skills
3 8 (5.30%) Public Sector
4 7 (4.64%) Marketing
5 6 (3.97%) Financial Institution
5 6 (3.97%) Legal
6 5 (3.31%) Retail
7 4 (2.65%) Banking
8 3 (1.99%) Manufacturing
9 2 (1.32%) Advertising
9 2 (1.32%) Documentation Skills
10 1 (0.66%) Influencing Skills
Job Titles
1 37 (24.50%) Trainer
2 26 (17.22%) Analyst
3 19 (12.58%) Developer
4 13 (8.61%) SAP Developer
5 12 (7.95%) Business Analyst
5 12 (7.95%) Consultant
6 9 (5.96%) Coordinator
6 9 (5.96%) IT Support
7 8 (5.30%) Integration Developer
8 7 (4.64%) Functional Consultant
8 7 (4.64%) NetSuite Consultant
8 7 (4.64%) Risk Manager
8 7 (4.64%) Senior
9 6 (3.97%) Systems Analyst
10 5 (3.31%) ABAP Developer
10 5 (3.31%) Applications Support
10 5 (3.31%) Applications Support Analyst
10 5 (3.31%) Architect
10 5 (3.31%) Product Manager
10 5 (3.31%) Support Analyst
Libraries, Frameworks & Software Standards
1 16 (10.60%) REST
2 13 (8.61%) BAPI
2 13 (8.61%) IBM Integration Bus
2 13 (8.61%) JMS
2 13 (8.61%) Middleware
2 13 (8.61%) OAuth
2 13 (8.61%) SAML
2 13 (8.61%) SOAP
3 5 (3.31%) EDI
3 5 (3.31%) React
4 4 (2.65%) HTML
5 3 (1.99%) AngularJS
5 3 (1.99%) Hibernate
5 3 (1.99%) RabbitMQ
5 3 (1.99%) Spring
5 3 (1.99%) Web Services
6 2 (1.32%) Playwright
7 1 (0.66%) CherryPy
7 1 (0.66%) Flask
7 1 (0.66%) Node.js
Miscellaneous
1 13 (8.61%) Enterprise Software
2 10 (6.62%) Analytical Mindset
3 8 (5.30%) Onboarding
4 5 (3.31%) Legacy Systems
4 5 (3.31%) Security Posture
5 4 (2.65%) Credit Risk
5 4 (2.65%) Self-Motivation
5 4 (2.65%) Taxonomies
6 3 (1.99%) Data Protection Act
6 3 (1.99%) Marketing Technology
7 2 (1.32%) IoT
7 2 (1.32%) Life Science
7 2 (1.32%) Product Ownership
8 1 (0.66%) Data Centre
8 1 (0.66%) Driving Licence
8 1 (0.66%) FMCG
8 1 (0.66%) Mobile App
8 1 (0.66%) Public Cloud
8 1 (0.66%) Renewable Energy
8 1 (0.66%) SCADA
Operating Systems
1 2 (1.32%) Linux
1 2 (1.32%) Windows
Processes & Methodologies
1 53 (35.10%) Problem-Solving
2 49 (32.45%) Artificial Intelligence
3 38 (25.17%) Conversational UI
4 37 (24.50%) Chemistry
5 25 (16.56%) Migration
6 23 (15.23%) Agile
6 23 (15.23%) Decision-Making
7 21 (13.91%) Analytics
7 21 (13.91%) Project Management
8 20 (13.25%) Requirements Gathering
9 18 (11.92%) CRM
10 17 (11.26%) ERP
11 15 (9.93%) High Availability
11 15 (9.93%) Stakeholder Management
12 14 (9.27%) Computer Science
12 14 (9.27%) Risk Management
13 13 (8.61%) API Management
13 13 (8.61%) Event-Driven
13 13 (8.61%) Event-Driven Architecture
14 12 (7.95%) Collaborative Working
Programming Languages
1 20 (13.25%) SQL
2 7 (4.64%) Python
3 6 (3.97%) ABAP
4 5 (3.31%) Java
5 3 (1.99%) PL/SQL
6 2 (1.32%) C#
7 1 (0.66%) Bash
7 1 (0.66%) JavaScript
7 1 (0.66%) R
Qualifications
1 54 (35.76%) Degree
2 37 (24.50%) Master's Degree
2 37 (24.50%) PhD
3 10 (6.62%) Computer Science Degree
4 6 (3.97%) CISM
4 6 (3.97%) CISSP
5 4 (2.65%) Security Cleared
6 3 (1.99%) Azure Certification
6 3 (1.99%) CITP
6 3 (1.99%) DV Cleared
6 3 (1.99%) ITIL Certification
6 3 (1.99%) Microsoft Certification
6 3 (1.99%) SANS
6 3 (1.99%) SC Cleared
7 2 (1.32%) CCAB
7 2 (1.32%) ISTQB
7 2 (1.32%) ISTQB Foundation Certification
8 1 (0.66%) AWS Certification
8 1 (0.66%) CBAP
8 1 (0.66%) DBS Check
Quality Assurance & Compliance
1 7 (4.64%) GDPR
2 5 (3.31%) ISO/IEC 27001
3 4 (2.65%) NIST
3 4 (2.65%) QA
4 3 (1.99%) California Consumer Privacy Act
4 3 (1.99%) SLA
5 2 (1.32%) Data Quality
5 2 (1.32%) IFRS
5 2 (1.32%) PMO
6 1 (0.66%) COBIT
6 1 (0.66%) SOC 2
System Software
1 1 (0.66%) Active Directory
1 1 (0.66%) Firmware
Systems Management
1 3 (1.99%) Kubernetes
2 2 (1.32%) Terraform
3 1 (0.66%) Ansible
3 1 (0.66%) FortiGate
3 1 (0.66%) Grafana
3 1 (0.66%) Prometheus
Vendors
1 37 (24.50%) PayPal
2 17 (11.26%) Microsoft
3 16 (10.60%) SAP
4 13 (8.61%) IBM
5 7 (4.64%) Salesforce
6 4 (2.65%) Oracle
6 4 (2.65%) ServiceNow
7 3 (1.99%) Avaloq
8 2 (1.32%) Cisco
8 2 (1.32%) Google
9 1 (0.66%) Databricks
9 1 (0.66%) Informatica
9 1 (0.66%) Kronos
9 1 (0.66%) Meraki
9 1 (0.66%) Pegasus
9 1 (0.66%) Salesforce Marketing Cloud
9 1 (0.66%) VMware
9 1 (0.66%) Workday