Java Jobs in the South West

Java
England > South West

The following table provides summary statistics for permanent job vacancies advertised in the South West with a requirement for Java skills. Included is a benchmarking guide to the salaries offered in vacancies that have cited Java over the 6 months to 7 December 2023 with a comparison to the same period in the previous 2 years.

6 months to
7 Dec 2023
Same period 2022 Same period 2021
Rank 18 15 19
Rank change year-on-year -3 +4 -6
Permanent jobs citing Java 566 1,040 793
As % of all permanent jobs advertised in the South West 12.12% 13.06% 10.99%
As % of the Programming Languages category 29.27% 30.20% 21.32%
Number of salaries quoted 357 479 467
10th Percentile £40,736 £38,700 £35,000
25th Percentile £47,500 £43,750 £42,500
Median annual salary (50th Percentile) £62,500 £57,500 £55,000
Median % change year-on-year +8.70% +4.55% +10.00%
75th Percentile £75,000 £75,625 £72,500
90th Percentile £91,934 £87,500 £80,771
England median annual salary £75,000 £75,000 £70,000
% change year-on-year - +7.14% +7.69%

All Programming Languages
South West

Java is in the Programming Languages category. The following table is for comparison with the above and provides summary statistics for all permanent job vacancies advertised in the South West with a requirement for coding skills.

Permanent vacancies with a requirement for coding skills 1,934 3,444 3,719
As % of all permanent jobs advertised in the South West 41.42% 43.24% 51.55%
Number of salaries quoted 1,426 2,261 2,542
10th Percentile £35,733 £32,500 £32,500
25th Percentile £43,750 £39,000 £38,200
Median annual salary (50th Percentile) £55,000 £52,500 £50,000
Median % change year-on-year +4.76% +5.00% +6.38%
75th Percentile £71,250 £68,750 £62,500
90th Percentile £82,500 £80,000 £75,000
England median annual salary £65,000 £65,000 £60,000
% change year-on-year - +8.33% +4.35%

Java
Job Vacancy Trend in the South West

Job postings citing Java as a proportion of all IT jobs advertised in the South West.
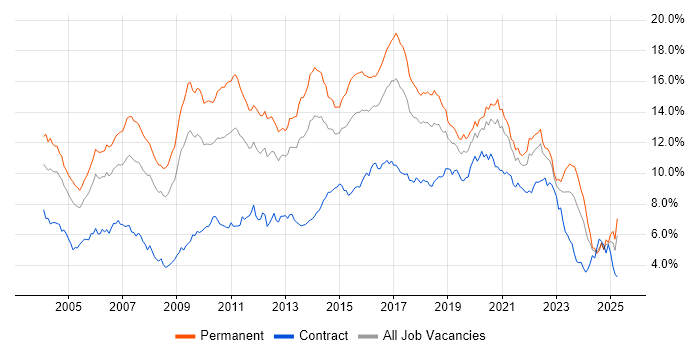
Job vacancy trend for Java in the South West

Java
Salary Trend in the South West

3-month moving average salary quoted in jobs citing Java in the South West.

Salary trend for Java in the South West

Java
Salary Histogram in the South West

Salary distribution for jobs citing Java in the South West over the 6 months to 7 December 2023.

Salary histogram for Java in the South West

Java
Job Locations in the South West

The table below looks at the demand and provides a guide to the median salaries quoted in IT jobs citing Java within the South West region over the 6 months to 7 December 2023. The 'Rank Change' column provides an indication of the change in demand within each location based on the same 6 month period last year.

Location Rank Change
on Same Period
Last Year
Matching
Permanent
IT Job Ads
Median Salary
Past 6 Months
Median Salary
% Change
on Same Period
Last Year
Live
Jobs
Bristol +3 269 £62,500 +4.17% 65
Gloucestershire -4 186 £58,000 +0.87% 25
Dorset +6 42 £57,500 -14.81% 9
Wiltshire -28 27 £70,000 +47.37% 17
Devon +16 19 £52,500 +50.00% 7
Somerset -18 13 £46,250 -19.57% 12
Java
England

Java
Co-occurring Skills and Capabilities in the South West by Category

The follow tables expand on the table above by listing co-occurrences grouped by category. The same employment type, locality and period is covered with up to 20 co-occurrences shown in each of the following categories:

Application Platforms
1 12 (2.12%) Jupyter
2 9 (1.59%) Apache Spark
2 9 (1.59%) Confluence
3 7 (1.24%) JBoss
3 7 (1.24%) Red Hat Fuse
4 5 (0.88%) Mule
4 5 (0.88%) Tomcat
5 4 (0.71%) Apache
5 4 (0.71%) CMS
5 4 (0.71%) WebSphere
6 3 (0.53%) Captiva
6 3 (0.53%) FileNet
6 3 (0.53%) Jetty
6 3 (0.53%) SAS
7 2 (0.35%) GeoServer
7 2 (0.35%) WordPress
8 1 (0.18%) Adobe Experience Manager
8 1 (0.18%) ArcGIS
8 1 (0.18%) Headless CMS
8 1 (0.18%) WebSphere Application Server
Applications
1 2 (0.35%) Microsoft Office
2 1 (0.18%) Microsoft Excel
2 1 (0.18%) Spreadsheet
Business Applications
1 1 (0.18%) Magento
1 1 (0.18%) SAP Hybris
1 1 (0.18%) Shopify
Cloud Services
1 271 (47.88%) AWS
2 188 (33.22%) Azure
3 79 (13.96%) OpenShift
4 74 (13.07%) GCP
5 49 (8.66%) Serverless
6 29 (5.12%) SaaS
7 17 (3.00%) AWS Lambda
8 15 (2.65%) GitHub
9 12 (2.12%) Amazon EC2
9 12 (2.12%) Amazon S3
10 11 (1.94%) Azure DevOps
11 6 (1.06%) GitHub Actions
12 5 (0.88%) Apigee
12 5 (0.88%) Cloud Computing
13 4 (0.71%) Amazon EKS
13 4 (0.71%) Datadog
14 3 (0.53%) Azure AKS
14 3 (0.53%) Azure Cosmos DB
14 3 (0.53%) Cloud Composer
15 2 (0.35%) Google Kubernetes Engine
Communications & Networking
1 39 (6.89%) DNS
1 39 (6.89%) HTTP
2 36 (6.36%) DHCP
2 36 (6.36%) TCP/IP
3 9 (1.59%) Internet
4 3 (0.53%) AMQP
4 3 (0.53%) Firewall
4 3 (0.53%) Kerberos
4 3 (0.53%) Network Security
5 1 (0.18%) 5G
5 1 (0.18%) Broadband
5 1 (0.18%) FTP
5 1 (0.18%) Tactical Data Link
5 1 (0.18%) Wireless
Database & Business Intelligence
1 53 (9.36%) Big Data
2 28 (4.95%) NoSQL
3 21 (3.71%) Relational Database
4 20 (3.53%) MySQL
4 20 (3.53%) PostgreSQL
5 17 (3.00%) Elasticsearch
5 17 (3.00%) MongoDB
6 13 (2.30%) Hadoop
7 12 (2.12%) Amazon RDS
8 11 (1.94%) BigQuery
8 11 (1.94%) Data Warehouse
8 11 (1.94%) RDBMS
8 11 (1.94%) SQL Server
9 8 (1.41%) Oracle Database
10 6 (1.06%) Amazon Redshift
10 6 (1.06%) Data Lake
11 5 (0.88%) DynamoDB
11 5 (0.88%) Flink
12 4 (0.71%) Parquet
13 3 (0.53%) OLAP Cube
Development Applications
1 80 (14.13%) Git
2 67 (11.84%) Jenkins
3 27 (4.77%) Cucumber
3 27 (4.77%) GitLab
3 27 (4.77%) Selenium
4 25 (4.42%) Cypress.io
5 24 (4.24%) JIRA
6 19 (3.36%) Maven
7 14 (2.47%) Sonatype Nexus
8 12 (2.12%) JUnit
9 9 (1.59%) Spinnaker
10 8 (1.41%) Bitbucket
10 8 (1.41%) Oracle Forms
11 7 (1.24%) IntelliJ
11 7 (1.24%) SonarQube
11 7 (1.24%) WebDriver
12 6 (1.06%) RequisitePro
13 5 (0.88%) REST Assured
13 5 (0.88%) TeamCity
14 4 (0.71%) Oracle APEX
General
1 131 (23.14%) Finance
2 72 (12.72%) Banking
3 62 (10.95%) Social Skills
4 40 (7.07%) Inclusion and Diversity
5 35 (6.18%) Public Sector
6 23 (4.06%) Retail
7 17 (3.00%) Police
8 14 (2.47%) Aerospace
9 12 (2.12%) Manufacturing
10 11 (1.94%) Tech for Good
10 11 (1.94%) Telecoms
11 9 (1.59%) Retail Banking
12 8 (1.41%) Electronics
12 8 (1.41%) Military
13 7 (1.24%) Analytical Skills
13 7 (1.24%) Aviation
14 5 (0.88%) Presentation Skills
15 4 (0.71%) Marketing
16 3 (0.53%) Financial Institution
16 3 (0.53%) Organisational Skills
Job Titles
1 184 (32.51%) Software Engineer
2 160 (28.27%) Developer
3 118 (20.85%) Senior
4 84 (14.84%) Java Developer
5 75 (13.25%) Java Engineer
6 64 (11.31%) Lead
7 46 (8.13%) Java Software Engineer
8 41 (7.24%) Senior Software Engineer
9 38 (6.71%) Senior Developer
10 37 (6.54%) DevOps Engineer
11 36 (6.36%) Data Engineer
12 30 (5.30%) Infrastructure Engineer
13 27 (4.77%) Architect
13 27 (4.77%) Software Developer
14 24 (4.24%) Android Developer
15 20 (3.53%) Data Scientist
15 20 (3.53%) Senior Java Developer
16 19 (3.36%) Lead Software Engineer
17 18 (3.18%) DV Cleared Software Engineer
18 17 (3.00%) Senior Data Scientist
Libraries, Frameworks & Software Standards
1 122 (21.55%) Spring
2 88 (15.55%) React
3 80 (14.13%) Spring Boot
4 60 (10.60%) AngularJS
5 56 (9.89%) Kafka
6 46 (8.13%) Hibernate
7 44 (7.77%) HTML
8 43 (7.60%) RESTful
9 34 (6.01%) Web Services
10 31 (5.48%) REST
11 27 (4.77%) .NET
12 20 (3.53%) Node.js
13 19 (3.36%) JSON
13 19 (3.36%) XML
14 15 (2.65%) J2EE
14 15 (2.65%) JPA
15 14 (2.47%) SOAP
16 13 (2.30%) Ruby on Rails
17 12 (2.12%) CSS
17 12 (2.12%) Flutter
Miscellaneous
1 33 (5.83%) Algorithms
1 33 (5.83%) Private Cloud
2 32 (5.65%) Public Cloud
3 29 (5.12%) Product Ownership
4 28 (4.95%) Cyberattack
5 15 (2.65%) Greenfield Project
6 13 (2.30%) Cloud Native
7 12 (2.12%) Legacy Systems
8 11 (1.94%) Distributed Systems
9 10 (1.77%) Virtual Team
10 9 (1.59%) Distributed Applications
10 9 (1.59%) NHS
11 8 (1.41%) Mobile App
12 7 (1.24%) Robotics
13 6 (1.06%) DataPower
13 6 (1.06%) Hybrid Cloud
14 5 (0.88%) Data Centre
14 5 (0.88%) Data Structures
14 5 (0.88%) Legacy Applications
15 4 (0.71%) Self-Motivation
Operating Systems
1 117 (20.67%) Linux
2 61 (10.78%) Windows
3 43 (7.60%) Android
4 38 (6.71%) Red Hat Enterprise Linux
5 25 (4.42%) Unix
6 16 (2.83%) Apple iOS
7 9 (1.59%) Windows Server
8 5 (0.88%) Solaris
9 2 (0.35%) Mac OS
10 1 (0.18%) CentOS
10 1 (0.18%) Ubuntu
10 1 (0.18%) VxWorks
Processes & Methodologies
1 296 (52.30%) Agile
2 272 (48.06%) Software Engineering
3 226 (39.93%) DevOps
4 149 (26.33%) Microservices
5 132 (23.32%) Actionable Insight
6 125 (22.08%) Mentoring
7 116 (20.49%) Problem-Solving
8 81 (14.31%) Test Automation
9 78 (13.78%) CI/CD
9 78 (13.78%) Containerisation
10 72 (12.72%) Unit Testing
11 70 (12.37%) Scrum
12 68 (12.01%) Continuous Integration
13 64 (11.31%) SDLC
14 62 (10.95%) Software Architecture
15 59 (10.42%) Design Patterns
16 56 (9.89%) Coaching
17 55 (9.72%) Full Stack Development
18 49 (8.66%) OO
18 49 (8.66%) Open Source
Programming Languages
1 263 (46.47%) Python
2 168 (29.68%) JavaScript
3 86 (15.19%) SQL
4 74 (13.07%) Bash
5 61 (10.78%) C#
6 60 (10.60%) C++
7 55 (9.72%) PowerShell
8 36 (6.36%) Go
9 31 (5.48%) Kotlin
10 28 (4.95%) Ruby
11 27 (4.77%) TypeScript
12 26 (4.59%) R
13 18 (3.18%) C
14 17 (3.00%) Scala
15 12 (2.12%) Perl
16 10 (1.77%) Rust
17 9 (1.59%) Groovy
18 8 (1.41%) PHP
19 5 (0.88%) Shell Script
20 3 (0.53%) Ada
Qualifications
1 241 (42.58%) Security Cleared
2 140 (24.73%) SC Cleared
3 101 (17.84%) DV Cleared
4 60 (10.60%) Degree
5 38 (6.71%) Computer Science Degree
6 6 (1.06%) APMP
7 5 (0.88%) ISTQB
7 5 (0.88%) OCP
7 5 (0.88%) Oracle Certification
8 4 (0.71%) AWS Certification
9 3 (0.53%) Sun Certification
10 2 (0.35%) AWS Certified Solutions Architect
10 2 (0.35%) BPSS Clearance
11 1 (0.18%) ITIL Certification
Quality Assurance & Compliance
1 39 (6.89%) QA
2 6 (1.06%) Accessibility
3 3 (0.53%) GDPR
3 3 (0.53%) IEC 61508
3 3 (0.53%) ISO 9001
4 1 (0.18%) Def Stans
4 1 (0.18%) Software Quality Assurance
4 1 (0.18%) TickIT
System Software
1 195 (34.45%) Docker
2 38 (6.71%) VMware Infrastructure
3 36 (6.36%) Hyper-V
4 1 (0.18%) Virtual Machines
4 1 (0.18%) vSphere
Systems Management
1 208 (36.75%) Kubernetes
2 60 (10.60%) Ansible
3 46 (8.13%) Puppet
4 33 (5.83%) Terraform
5 6 (1.06%) HP Quality Center
5 6 (1.06%) Progress Chef
6 5 (0.88%) Istio
7 4 (0.71%) Nagios
7 4 (0.71%) Packer
8 2 (0.35%) Argo
8 2 (0.35%) Single Sign-On
9 1 (0.18%) Docker Swarm
Vendors
1 42 (7.42%) Oracle
2 39 (6.89%) Red Hat
3 38 (6.71%) VMware
4 21 (3.71%) Google
5 17 (3.00%) IBM
6 16 (2.83%) Microsoft
7 9 (1.59%) SAP
8 7 (1.24%) Atlassian
9 6 (1.06%) HP
10 5 (0.88%) Teradata
11 4 (0.71%) New Relic
11 4 (0.71%) ServiceNow
11 4 (0.71%) Splunk
12 3 (0.53%) Apple
12 3 (0.53%) Kofax
12 3 (0.53%) Pega
12 3 (0.53%) Samsung
13 2 (0.35%) Confluent
13 2 (0.35%) Veracode
14 1 (0.18%) ESRI