Presentation Skills Jobs in Bristol

Presentation Skills
South West > Bristol

The table below looks at the prevalence of the term Presentation Skills in permanent job vacancies advertised in Bristol. Included is a benchmarking guide to the salaries offered in vacancies that have cited Presentation Skills over the 6 months to 18 May 2024 with a comparison to the same period over the previous 2 years.

6 months to
18 May 2024
Same period 2023 Same period 2022
Rank 98 97 102
Rank change year-on-year -1 +5 +13
Permanent jobs citing Presentation Skills 63 68 95
As % of all permanent jobs advertised in Bristol 2.01% 2.64% 2.85%
As % of the General category 3.95% 3.88% 4.59%
Number of salaries quoted 38 18 58
10th Percentile £37,500 £34,950 £31,250
25th Percentile £42,750 £43,251 £40,416
Median annual salary (50th Percentile) £50,000 £45,750 £60,000
Median % change year-on-year +9.29% -23.75% -14.29%
75th Percentile £61,123 £70,625 £65,750
90th Percentile £72,433 £85,000 £70,075
South West median annual salary £45,000 £43,999 £54,056
% change year-on-year +2.28% -18.60% -1.72%

All General Skills
Bristol

Presentation Skills is in the General Skills category. The following table is for comparison with the above and provides summary statistics for all permanent job vacancies advertised in Bristol with a requirement for common skills.

Permanent vacancies with a requirement for common skills 1,593 1,753 2,071
As % of all permanent jobs advertised in Bristol 50.73% 67.97% 62.02%
Number of salaries quoted 1,157 1,003 1,401
10th Percentile £31,250 £31,314 £31,250
25th Percentile £41,250 £42,500 £38,750
Median annual salary (50th Percentile) £55,000 £56,159 £52,500
Median % change year-on-year -2.06% +6.97% +10.53%
75th Percentile £72,433 £74,250 £70,400
90th Percentile £91,524 £87,419 £90,000
South West median annual salary £47,500 £50,000 £48,750
% change year-on-year -5.00% +2.56% +8.33%

Presentation Skills
Job Vacancy Trend in Bristol

Job postings citing Presentation Skills as a proportion of all IT jobs advertised in Bristol.
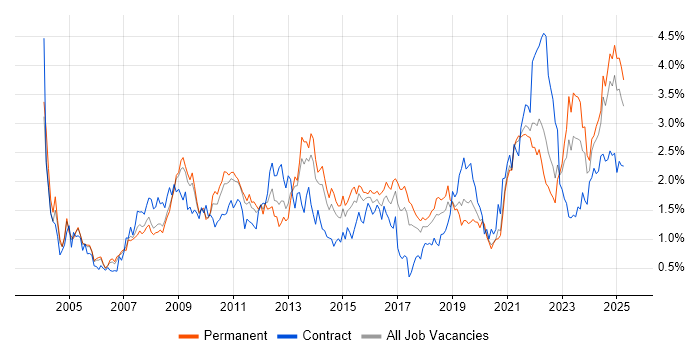
Job vacancy trend for Presentation Skills in Bristol

Presentation Skills
Salary Trend in Bristol

3-month moving average salary quoted in jobs citing Presentation Skills in Bristol.

Salary trend for Presentation Skills in Bristol

Presentation Skills
Salary Histogram in Bristol

Salary distribution for jobs citing Presentation Skills in Bristol over the 6 months to 18 May 2024.

Salary histogram for Presentation Skills in Bristol

Presentation Skills
Co-occurring Skills and Capabilities in Bristol by Category

The follow tables expand on the table above by listing co-occurrences grouped by category. The same employment type, locality and period is covered with up to 20 co-occurrences shown in each of the following categories:

Application Platforms
1 3 (4.76%) SharePoint
2 2 (3.17%) Microsoft Exchange
Applications
1 2 (3.17%) SketchUp
2 1 (1.59%) Microsoft Excel
2 1 (1.59%) Microsoft Project
2 1 (1.59%) MS Visio
Business Applications
1 1 (1.59%) Unit4 Business World
Cloud Services
1 20 (31.75%) Azure
2 15 (23.81%) AWS
3 14 (22.22%) GCP
4 10 (15.87%) Microsoft 365
4 10 (15.87%) Power Platform
5 9 (14.29%) SaaS
6 5 (7.94%) Adobe Analytics
7 2 (3.17%) Collibra
7 2 (3.17%) Entra ID
7 2 (3.17%) IaaS
7 2 (3.17%) OCI
7 2 (3.17%) OneDrive
8 1 (1.59%) Cloud Computing
Communications & Networking
1 2 (3.17%) Firewall
1 2 (3.17%) Internet
1 2 (3.17%) TCP/IP
1 2 (3.17%) Wireless
1 2 (3.17%) Wireless Security
Database & Business Intelligence
1 10 (15.87%) Power BI
2 5 (7.94%) Data Warehouse
3 4 (6.35%) Azure SQL Data Warehouse
3 4 (6.35%) Data Lake
4 3 (4.76%) Big Data
5 2 (3.17%) Tableau
6 1 (1.59%) Ataccama
6 1 (1.59%) BigQuery
6 1 (1.59%) Data Vault
6 1 (1.59%) Relational Database
Development Applications
1 2 (3.17%) Burp Suite
1 2 (3.17%) Metasploit
2 1 (1.59%) Git
2 1 (1.59%) JIRA
General
1 36 (57.14%) Social Skills
2 18 (28.57%) Analytical Skills
3 16 (25.40%) Finance
4 10 (15.87%) Banking
5 7 (11.11%) Retail
6 5 (7.94%) Marketing
7 3 (4.76%) Legal
8 2 (3.17%) Publishing
8 2 (3.17%) Retail Banking
9 1 (1.59%) Aerospace
9 1 (1.59%) Automotive
9 1 (1.59%) Electronics
9 1 (1.59%) Inclusion and Diversity
9 1 (1.59%) Law
9 1 (1.59%) Organisational Skills
9 1 (1.59%) Social Housing
Job Titles
1 12 (19.05%) Analyst
1 12 (19.05%) Architect
2 10 (15.87%) Senior
3 8 (12.70%) Cloud Architect
4 6 (9.52%) Business Intelligence Analyst
4 6 (9.52%) Penetration Tester
4 6 (9.52%) Power BI Analyst
4 6 (9.52%) SQL Analyst
4 6 (9.52%) Tester
5 5 (7.94%) Developer
5 5 (7.94%) Digital Analyst
5 5 (7.94%) IT Manager
6 4 (6.35%) Business Intelligence Developer
6 4 (6.35%) Consultant
6 4 (6.35%) Data Consultant
6 4 (6.35%) Senior Consultant
6 4 (6.35%) Senior Technology Consultant
6 4 (6.35%) Technology Consultant
7 3 (4.76%) Report Developer
7 3 (4.76%) Solutions Architect
Libraries, Frameworks & Software Standards
1 4 (6.35%) Kafka
2 3 (4.76%) Spring Boot
3 1 (1.59%) Django
3 1 (1.59%) Flask
Miscellaneous
1 7 (11.11%) PKI
1 7 (11.11%) Public Cloud
2 6 (9.52%) Security Posture
3 4 (6.35%) Robotics
4 3 (4.76%) Blockchain
4 3 (4.76%) Self-Motivation
5 2 (3.17%) Embedded Systems
5 2 (3.17%) Management Information System
5 2 (3.17%) Mobile App
5 2 (3.17%) Onboarding
5 2 (3.17%) PMI
5 2 (3.17%) Product Ownership
6 1 (1.59%) Algorithms
6 1 (1.59%) Analytical Mindset
Operating Systems
1 4 (6.35%) Windows
2 2 (3.17%) Apple iOS
2 2 (3.17%) Kali Linux
2 2 (3.17%) Unix
Processes & Methodologies
1 24 (38.10%) Problem-Solving
2 20 (31.75%) Analytics
3 17 (26.98%) Agile
4 15 (23.81%) Actionable Insight
5 13 (20.63%) Business Intelligence
5 13 (20.63%) Project Management
6 12 (19.05%) Visualisation
7 11 (17.46%) Data Visualisation
7 11 (17.46%) Presales
8 10 (15.87%) Data Analysis
9 9 (14.29%) Collaborative Working
10 8 (12.70%) Cybersecurity
10 8 (12.70%) Data Strategy
10 8 (12.70%) Stakeholder Management
10 8 (12.70%) TOGAF
11 7 (11.11%) Application Virtualisation
11 7 (11.11%) Artificial Intelligence
11 7 (11.11%) Configuration Management
11 7 (11.11%) Migration
12 6 (9.52%) Data Transformation
Programming Languages
1 9 (14.29%) SQL
2 3 (4.76%) Java
2 3 (4.76%) Python
3 2 (3.17%) Bash
3 2 (3.17%) C#
4 1 (1.59%) MATLAB
4 1 (1.59%) R
Qualifications
1 13 (20.63%) Degree
2 4 (6.35%) AWS Certification
2 4 (6.35%) Azure Certification
2 4 (6.35%) Computer Science Degree
3 3 (4.76%) Security Cleared
4 2 (3.17%) BPSS Clearance
4 2 (3.17%) CHECK Team Member
4 2 (3.17%) CompTIA Security+
4 2 (3.17%) CREST Certified
4 2 (3.17%) CSPO
4 2 (3.17%) HNC
4 2 (3.17%) OSCP
4 2 (3.17%) PMI Certification
5 1 (1.59%) CBAP
5 1 (1.59%) ISEB
5 1 (1.59%) MAPM
5 1 (1.59%) SC Cleared
Quality Assurance & Compliance
1 5 (7.94%) Actionable Recommendations
2 3 (4.76%) ISO 22301
3 2 (3.17%) Cyber Essentials
3 2 (3.17%) Data Quality
3 2 (3.17%) ISO/IEC 27001
4 1 (1.59%) PMO
System Software
1 3 (4.76%) Docker
2 2 (3.17%) Active Directory
Systems Management
1 3 (4.76%) Kubernetes
2 2 (3.17%) CASB
2 2 (3.17%) Microsoft Intune
2 2 (3.17%) Nmap
Vendors
1 9 (14.29%) Microsoft
2 8 (12.70%) Google
3 6 (9.52%) Adobe
4 5 (7.94%) Glassbox
5 4 (6.35%) Oracle
6 3 (4.76%) Salesforce
7 2 (3.17%) Databricks
7 2 (3.17%) SAP
8 1 (1.59%) Civica
8 1 (1.59%) Northgate