Presentation Skills Jobs in Edinburgh

Presentation Skills
Scotland > Edinburgh

The table below looks at the prevalence of the term Presentation Skills in permanent job vacancies advertised in Edinburgh. Included is a benchmarking guide to the salaries offered in vacancies that have cited Presentation Skills over the 6 months to 10 May 2024 with a comparison to the same period over the previous 2 years.

6 months to
10 May 2024
Same period 2023 Same period 2022
Rank 60 93 114
Rank change year-on-year +33 +21 +2
Permanent jobs citing Presentation Skills 51 55 44
As % of all permanent jobs advertised in Edinburgh 3.40% 2.68% 1.86%
As % of the General category 5.65% 3.41% 2.84%
Number of salaries quoted 30 13 37
10th Percentile £22,750 £36,350 £32,200
25th Percentile £37,797 £43,750 £50,000
Median annual salary (50th Percentile) £60,000 £47,500 £60,000
Median % change year-on-year +26.32% -20.83% +4.35%
75th Percentile £71,825 £72,500 £71,250
90th Percentile £90,082 £80,000 £73,750
Scotland median annual salary £65,000 £56,736 £60,000
% change year-on-year +14.57% -5.44% +26.32%

All General Skills
Edinburgh

Presentation Skills is in the General Skills category. The following table is for comparison with the above and provides summary statistics for all permanent job vacancies advertised in Edinburgh with a requirement for common skills.

Permanent vacancies with a requirement for common skills 902 1,612 1,551
As % of all permanent jobs advertised in Edinburgh 60.05% 78.52% 65.53%
Number of salaries quoted 675 945 993
10th Percentile £32,500 £35,840 £33,540
25th Percentile £46,250 £44,033 £43,750
Median annual salary (50th Percentile) £60,000 £60,000 £55,000
Median % change year-on-year - +9.09% +8.91%
75th Percentile £73,886 £78,750 £67,500
90th Percentile £95,923 £95,000 £83,995
Scotland median annual salary £50,000 £57,500 £54,500
% change year-on-year -13.04% +5.50% +9.00%

Presentation Skills
Job Vacancy Trend in Edinburgh

Job postings citing Presentation Skills as a proportion of all IT jobs advertised in Edinburgh.
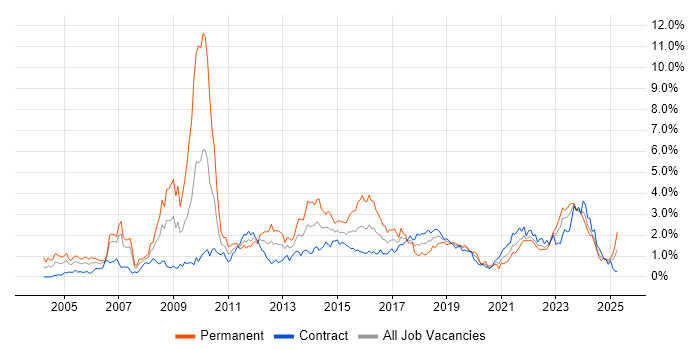
Job vacancy trend for Presentation Skills in Edinburgh

Presentation Skills
Salary Trend in Edinburgh

3-month moving average salary quoted in jobs citing Presentation Skills in Edinburgh.

Salary trend for Presentation Skills in Edinburgh

Presentation Skills
Salary Histogram in Edinburgh

Salary distribution for jobs citing Presentation Skills in Edinburgh over the 6 months to 10 May 2024.

Salary histogram for Presentation Skills in Edinburgh

Presentation Skills
Co-occurring Skills and Capabilities in Edinburgh by Category

The follow tables expand on the table above by listing co-occurrences grouped by category. The same employment type, locality and period is covered with up to 20 co-occurrences shown in each of the following categories:

Application Platforms
1 2 (3.92%) Apache
1 2 (3.92%) Apache Spark
1 2 (3.92%) SAS
Applications
1 6 (11.76%) Microsoft Excel
1 6 (11.76%) Microsoft Office
1 6 (11.76%) Microsoft PowerPoint
Cloud Services
1 19 (37.25%) GCP
2 16 (31.37%) Azure
3 15 (29.41%) Microsoft 365
4 13 (25.49%) AWS
5 8 (15.69%) SaaS
6 3 (5.88%) OpenShift
7 2 (3.92%) Azure DevOps
7 2 (3.92%) Collibra
8 1 (1.96%) Cloud Computing
8 1 (1.96%) Power Platform
8 1 (1.96%) Vertex AI
Communications & Networking
1 2 (3.92%) TCP/IP
Database & Business Intelligence
1 4 (7.84%) Data Warehouse
2 3 (5.88%) Azure SQL Data Warehouse
2 3 (5.88%) Data Lake
3 1 (1.96%) Ataccama
3 1 (1.96%) BigQuery
3 1 (1.96%) Data Vault
3 1 (1.96%) Power BI
3 1 (1.96%) Tableau
Development Applications
1 3 (5.88%) IBM UrbanCode
2 2 (3.92%) Git
General
1 27 (52.94%) Social Skills
2 18 (35.29%) Finance
3 12 (23.53%) Banking
4 5 (9.80%) Analytical Skills
4 5 (9.80%) Public Sector
5 3 (5.88%) Inclusion and Diversity
5 3 (5.88%) Retail
6 2 (3.92%) Aerospace
6 2 (3.92%) Influencing Skills
6 2 (3.92%) Law
6 2 (3.92%) Organisational Skills
7 1 (1.96%) Marketing
Job Titles
1 15 (29.41%) Senior
2 8 (15.69%) Architect
3 7 (13.73%) Cloud Architect
3 7 (13.73%) IT Assistant
4 6 (11.76%) Data Manager
5 5 (9.80%) Analyst
5 5 (9.80%) DevOps Engineer
5 5 (9.80%) Strategy Manager
6 4 (7.84%) Support Engineer
7 3 (5.88%) Consultant
7 3 (5.88%) Data Consultant
7 3 (5.88%) Senior Consultant
7 3 (5.88%) Senior DevOps
7 3 (5.88%) Senior DevOps Engineer
7 3 (5.88%) Senior Manager
7 3 (5.88%) Senior Support Engineer
7 3 (5.88%) Senior Technology Consultant
7 3 (5.88%) Technology Consultant
8 2 (3.92%) Commercial Officer
8 2 (3.92%) Senior Strategy Manager
Libraries, Frameworks & Software Standards
1 1 (1.96%) Kafka
1 1 (1.96%) Oracle Fusion
Miscellaneous
1 10 (19.61%) Public Cloud
2 7 (13.73%) PKI
3 5 (9.80%) Self-Motivation
4 4 (7.84%) Renewable Energy
5 3 (5.88%) Credit Risk
6 2 (3.92%) Foreign Exchange (FX)
6 2 (3.92%) Product Ownership
Operating Systems
1 5 (9.80%) Linux
2 3 (5.88%) Windows
Processes & Methodologies
1 14 (27.45%) Agile
2 10 (19.61%) Actionable Insight
2 10 (19.61%) Analytics
2 10 (19.61%) Presales
2 10 (19.61%) Project Management
3 8 (15.69%) Data Engineering
3 8 (15.69%) Storytelling
3 8 (15.69%) TOGAF
4 7 (13.73%) Application Virtualisation
4 7 (13.73%) Change Management
4 7 (13.73%) Configuration Management
4 7 (13.73%) DevOps
4 7 (13.73%) Migration
4 7 (13.73%) Project Planning
5 6 (11.76%) Artificial Intelligence
5 6 (11.76%) Mentoring
5 6 (11.76%) Technical Leadership
6 5 (9.80%) Business Analysis
6 5 (9.80%) Stakeholder Management
6 5 (9.80%) Time Management
Programming Languages
1 6 (11.76%) SQL
2 5 (9.80%) Python
3 3 (5.88%) Groovy
4 2 (3.92%) R
Qualifications
1 7 (13.73%) Degree
2 3 (5.88%) AWS Certification
2 3 (5.88%) Azure Certification
3 1 (1.96%) Oracle Certification
3 1 (1.96%) SC Cleared
3 1 (1.96%) Security Cleared
Quality Assurance & Compliance
1 2 (3.92%) Accessibility
1 2 (3.92%) CRD IV
1 2 (3.92%) Data Quality
1 2 (3.92%) IFRS
1 2 (3.92%) IFRS 9
2 1 (1.96%) Basel III
Systems Management
1 5 (9.80%) Terraform
2 3 (5.88%) Ansible
2 3 (5.88%) Progress Chef
Vendors
1 21 (41.18%) Microsoft
2 11 (21.57%) Google
3 3 (5.88%) IBM
4 2 (3.92%) Cisco
4 2 (3.92%) Juniper
4 2 (3.92%) Oracle
4 2 (3.92%) SAP