Windows Jobs in Essex

Microsoft Windows
East of England > Essex

The following table provides summary statistics for permanent job vacancies advertised in Essex with a requirement for Windows skills. Included is a benchmarking guide to the salaries offered in vacancies that have cited Windows over the 6 months to 28 April 2024 with a comparison to the same period in the previous 2 years.

6 months to
28 Apr 2024
Same period 2023 Same period 2022
Rank 5 18 13
Rank change year-on-year +13 -5 -2
Permanent jobs citing Windows 143 107 128
As % of all permanent jobs advertised in Essex 16.31% 12.56% 13.68%
As % of the Operating Systems category 86.14% 72.30% 70.72%
Number of salaries quoted 130 92 84
10th Percentile £22,750 £25,000 £24,825
25th Percentile £25,759 £26,250 £26,438
Median annual salary (50th Percentile) £28,000 £37,750 £38,500
Median % change year-on-year -25.83% -1.95% -13.48%
75th Percentile £33,750 £59,063 £52,500
90th Percentile £43,750 £80,000 £65,875
East of England median annual salary £32,500 £39,113 £38,500
% change year-on-year -16.91% +1.59% -7.23%

All Operating Systems
Essex

Windows is in the Operating Systems category. The following table is for comparison with the above and provides summary statistics for all permanent job vacancies advertised in Essex with a requirement for operating system skills.

Permanent vacancies with a requirement for operating system skills 166 148 181
As % of all permanent jobs advertised in Essex 18.93% 17.37% 19.34%
Number of salaries quoted 149 110 97
10th Percentile £23,350 £25,000 £24,900
25th Percentile £25,759 £26,250 £26,500
Median annual salary (50th Percentile) £30,000 £40,000 £38,500
Median % change year-on-year -25.00% +3.90% -18.95%
75th Percentile £40,000 £61,875 £52,500
90th Percentile £51,200 £80,000 £65,000
East of England median annual salary £38,000 £47,500 £42,500
% change year-on-year -20.00% +11.76% -10.53%

Windows
Job Vacancy Trend in Essex

Job postings citing Windows as a proportion of all IT jobs advertised in Essex.
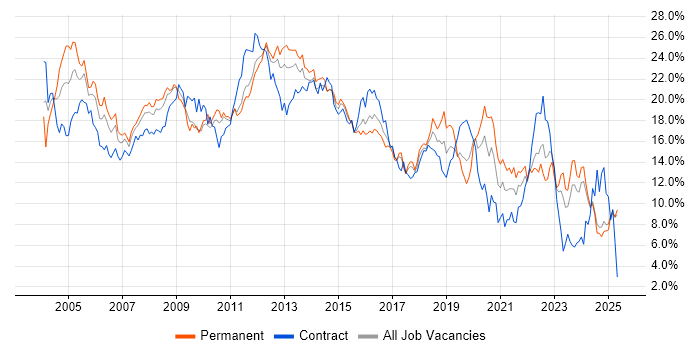
Job vacancy trend for Windows in Essex

Windows
Salary Trend in Essex

3-month moving average salary quoted in jobs citing Windows in Essex.

Salary trend for Windows in Essex

Windows
Salary Histogram in Essex

Salary distribution for jobs citing Windows in Essex over the 6 months to 28 April 2024.

Salary histogram for Windows in Essex

Windows
Job Locations in Essex

The table below looks at the demand and provides a guide to the median salaries quoted in IT jobs citing Windows within the Essex region over the 6 months to 28 April 2024. The 'Rank Change' column provides an indication of the change in demand within each location based on the same 6 month period last year.

Location Rank Change
on Same Period
Last Year
Matching
Permanent
IT Job Ads
Median Salary
Past 6 Months
Median Salary
% Change
on Same Period
Last Year
Live
Jobs
Basildon +9 41 £27,000 -1.82% 3
Chelmsford +9 21 £29,000 +5.45%
Brentwood - 13 £37,500 - 1
Harlow -1 12 £23,500 -44.71% 3
Saffron Walden - 11 £30,000 - 3
Grays -2 7 £27,500 - 1
Thurrock 0 6 £27,000 -66.25%
Colchester -9 6 £85,000 +69.15% 3
Witham - 4 £30,000 -
Loughton +2 2 £32,500 +1.56% 1
Maldon -5 1 £35,000 +27.27% 1
Billericay -6 1 £37,500 -48.28%
Windows
East of England

Windows
Co-occurring Skills and Capabilities in Essex by Category

The follow tables expand on the table above by listing co-occurrences grouped by category. The same employment type, locality and period is covered with up to 20 co-occurrences shown in each of the following categories:

Application Platforms
1 23 (16.08%) Microsoft Exchange
2 16 (11.19%) SharePoint
3 2 (1.40%) Exchange Server 2003
3 2 (1.40%) Exchange Server 2007
3 2 (1.40%) Exchange Server 2010
3 2 (1.40%) Exchange Server 2013
3 2 (1.40%) Skype for Business
4 1 (0.70%) IIS
Applications
1 55 (38.46%) Microsoft Office
2 7 (4.90%) Spreadsheet
3 4 (2.80%) Microsoft Excel
4 1 (0.70%) Chatbot
Cloud Services
1 74 (51.75%) Microsoft 365
2 31 (21.68%) Azure
3 13 (9.09%) AWS
4 10 (6.99%) Amazon EC2
5 8 (5.59%) Entra ID
6 5 (3.50%) OneDrive
7 4 (2.80%) Google Workspace
8 3 (2.10%) Amazon CloudWatch
8 3 (2.10%) Amazon ECR
8 3 (2.10%) Amazon EKS
8 3 (2.10%) Amazon S3
8 3 (2.10%) Amazon SQS
8 3 (2.10%) AWS CloudFormation
8 3 (2.10%) AWS KMS
8 3 (2.10%) Azure DevOps
8 3 (2.10%) Loggly
8 3 (2.10%) Mimecast
8 3 (2.10%) Rackspace Cloud
9 2 (1.40%) Nutanix
10 1 (0.70%) ChatGPT
Communications & Networking
1 27 (18.88%) Firewall
2 19 (13.29%) TCP/IP
3 18 (12.59%) DHCP
3 18 (12.59%) DNS
4 10 (6.99%) VoIP
5 9 (6.29%) WAN
6 8 (5.59%) LAN
6 8 (5.59%) VSAN
6 8 (5.59%) Wi-Fi
7 7 (4.90%) VLAN
7 7 (4.90%) Wireless
8 5 (3.50%) VPN
9 3 (2.10%) Network Security
10 2 (1.40%) MPLS
10 2 (1.40%) Remote Desktop
10 2 (1.40%) SAN
10 2 (1.40%) Skype
10 2 (1.40%) VPLS
10 2 (1.40%) WLAN
11 1 (0.70%) Internet
Database & Business Intelligence
1 4 (2.80%) Amazon RDS
2 3 (2.10%) Amazon Aurora
3 2 (1.40%) SQL Server
Development Applications
1 6 (4.20%) Bitbucket
2 3 (2.10%) Atlassian Bamboo
2 3 (2.10%) Git
2 3 (2.10%) Jenkins
2 3 (2.10%) Octopus Deploy
General
1 56 (39.16%) Social Skills
2 21 (14.69%) Analytical Skills
3 15 (10.49%) Manufacturing
4 13 (9.09%) Organisational Skills
5 8 (5.59%) Finance
5 8 (5.59%) Police
6 7 (4.90%) Retail
7 6 (4.20%) Marketing
8 5 (3.50%) Pharmaceutical
9 4 (2.80%) Inclusion and Diversity
10 3 (2.10%) Games
11 2 (1.40%) Automotive
11 2 (1.40%) Law
11 2 (1.40%) Legal
12 1 (0.70%) Back Office
12 1 (0.70%) Local Government
12 1 (0.70%) Telecoms
Job Titles
1 53 (37.06%) IT Support
2 39 (27.27%) Support Technician
3 35 (24.48%) Support Engineer
4 34 (23.78%) IT Technician
5 31 (21.68%) IT Support Technician
6 21 (14.69%) Analyst
6 21 (14.69%) IT Engineer
6 21 (14.69%) IT Support Engineer
7 16 (11.19%) IT Analyst
8 14 (9.79%) 2nd Line Support
9 13 (9.09%) 2nd Line Engineer
9 13 (9.09%) 2nd Line Support Engineer
10 10 (6.99%) Lead
11 9 (6.29%) Field Engineer
11 9 (6.29%) Field Service Engineer
12 8 (5.59%) 1st Line Support
12 8 (5.59%) LIMS Support
12 8 (5.59%) Service Desk Technician
12 8 (5.59%) Systems Analyst
13 7 (4.90%) IT Assistant
Libraries, Frameworks & Software Standards
1 3 (2.10%) .NET
1 3 (2.10%) .NET Framework
1 3 (2.10%) ADO
1 3 (2.10%) ASP.NET
1 3 (2.10%) ASP.NET Web API
Miscellaneous
1 17 (11.89%) NHS
2 13 (9.09%) Self-Motivation
3 11 (7.69%) Driving Licence
4 9 (6.29%) EPoS
5 8 (5.59%) Clustering
5 8 (5.59%) LIMS
5 8 (5.59%) Operational Technology
6 7 (4.90%) Smartcard
7 6 (4.20%) Educational Technology
8 3 (2.10%) Linux Command Line
9 2 (1.40%) CMDB
9 2 (1.40%) iPad
10 1 (0.70%) Onboarding
Operating Systems
1 72 (50.35%) Windows 10
2 49 (34.27%) Windows Server
3 9 (6.29%) Android
4 7 (4.90%) Linux
5 5 (3.50%) Windows Server 2008
6 4 (2.80%) Apple iOS
6 4 (2.80%) Mac OS
7 2 (1.40%) Windows Server 2003
7 2 (1.40%) Windows Server 2016
7 2 (1.40%) Windows Server 2019
8 1 (0.70%) Unix
8 1 (0.70%) Windows Server 2012
Processes & Methodologies
1 63 (44.06%) Problem-Solving
2 34 (23.78%) Customer Service
3 29 (20.28%) ITIL
4 19 (13.29%) Time Management
5 10 (6.99%) Cybersecurity
6 9 (6.29%) Break/Fix
6 9 (6.29%) ERP
7 8 (5.59%) Coaching
7 8 (5.59%) Collaborative Culture
7 8 (5.59%) Emotional Intelligence
7 8 (5.59%) Information Governance
8 7 (4.90%) Agile
8 7 (4.90%) CRM
8 7 (4.90%) Decision-Making
8 7 (4.90%) Innovative Thinking
9 6 (4.20%) IT Strategy
10 5 (3.50%) Mobile Device Management
10 5 (3.50%) Server Management
11 4 (2.80%) DevOps
11 4 (2.80%) Mentoring
Programming Languages
1 10 (6.99%) SQL
2 8 (5.59%) PowerShell
3 7 (4.90%) JavaScript
4 3 (2.10%) C#
4 3 (2.10%) Ruby
Qualifications
1 15 (10.49%) A+ Certification
2 13 (9.09%) Degree
3 12 (8.39%) Microsoft Certification
4 8 (5.59%) DBS Check
4 8 (5.59%) Security Cleared
5 5 (3.50%) CCNA
5 5 (3.50%) Cisco Certification
6 2 (1.40%) Azure Certification
6 2 (1.40%) BPSS Clearance
6 2 (1.40%) ITIL Certification
6 2 (1.40%) MCITP
6 2 (1.40%) MCSE
7 1 (0.70%) CWNA
7 1 (0.70%) Network+ Certification
7 1 (0.70%) VMware Certified Professional (VCP)
Quality Assurance & Compliance
1 15 (10.49%) SLA
2 3 (2.10%) GDPR
2 3 (2.10%) ISO/IEC 27001
System Software
1 69 (48.25%) Active Directory
2 27 (18.88%) VMware Infrastructure
3 22 (15.38%) Hyper-V
4 8 (5.59%) VMware ESXi
5 4 (2.80%) Firmware
5 4 (2.80%) vSphere
6 3 (2.10%) Docker
7 2 (1.40%) VMware Workstation
8 1 (0.70%) Virtual Desktop
Systems Management
1 8 (5.59%) Failover Clustering
2 3 (2.10%) Ansible
2 3 (2.10%) Jamf Pro
2 3 (2.10%) Kubernetes
2 3 (2.10%) Puppet
2 3 (2.10%) SCCM
2 3 (2.10%) Terraform
3 2 (1.40%) Active Directory Federation Services
3 2 (1.40%) Microsoft Intune
3 2 (1.40%) SCOM
3 2 (1.40%) Single Sign-On
3 2 (1.40%) WSUS
4 1 (0.70%) Autotask
4 1 (0.70%) FortiGate
Vendors
1 97 (67.83%) Microsoft
2 43 (30.07%) VMware
3 11 (7.69%) Dell
4 9 (6.29%) HP
4 9 (6.29%) IBM
5 8 (5.59%) Google
6 5 (3.50%) SolarWinds
7 4 (2.80%) Mitel
7 4 (2.80%) ServiceNow
8 3 (2.10%) Citrix
8 3 (2.10%) Meraki
8 3 (2.10%) New Relic
8 3 (2.10%) Rackspace
8 3 (2.10%) SonicWALL
9 2 (1.40%) Acronis
9 2 (1.40%) Aruba
9 2 (1.40%) EqualLogic
9 2 (1.40%) F5
9 2 (1.40%) Infoblox
9 2 (1.40%) Veeam