Senior
South East > Kent
The median Senior salary in Kent is £55,000 per year, according to job vacancies posted during the 6 months leading to 31 May 2025.
The table below provides salary benchmarking and summary statistics, comparing them to the same period in the previous two years.
| 6 months to 31 May 2025 |
Same period 2024 | Same period 2023 | |
|---|---|---|---|
| Rank | 7 | 13 | 16 |
| Rank change year-on-year | +6 | +3 | 0 |
| Permanent jobs requiring a Senior | 122 | 169 | 122 |
| As % of all permanent jobs advertised in Kent | 15.01% | 10.77% | 11.43% |
| As % of the Job Titles category | 21.82% | 11.49% | 13.38% |
| Number of salaries quoted | 61 | 126 | 59 |
| 10th Percentile | £46,000 | £40,000 | £47,550 |
| 25th Percentile | £48,000 | £48,406 | £52,500 |
| Median annual salary (50th Percentile) | £55,000 | £60,000 | £57,500 |
| Median % change year-on-year | -8.33% | +4.35% | -17.86% |
| 75th Percentile | £67,500 | £68,438 | £62,500 |
| 90th Percentile | £70,500 | £82,500 | £68,750 |
| South East median annual salary | £62,000 | £60,000 | £67,500 |
| % change year-on-year | +3.33% | -11.11% | +3.85% |
All Permanent IT Job Vacancies
Kent
For comparison with the information above, the following table provides summary statistics for all permanent IT job vacancies in Kent. Most job vacancies include a discernible job title that can be normalized. As such, the figures in the second row provide an indication of the number of permanent jobs in our overall sample.
| Permanent vacancies in Kent with a recognized job title | 559 | 1,471 | 912 |
| % of permanent jobs with a recognized job title | 68.76% | 93.75% | 85.47% |
| Number of salaries quoted | 333 | 1,080 | 506 |
| 10th Percentile | £26,000 | £25,500 | £27,500 |
| 25th Percentile | £30,250 | £31,250 | £35,000 |
| Median annual salary (50th Percentile) | £42,500 | £42,500 | £46,500 |
| Median % change year-on-year | - | -8.60% | +3.33% |
| 75th Percentile | £57,500 | £60,000 | £60,600 |
| 90th Percentile | £67,500 | £70,000 | £70,000 |
| South East median annual salary | £55,000 | £50,000 | £55,000 |
| % change year-on-year | +10.00% | -9.09% | - |
Senior
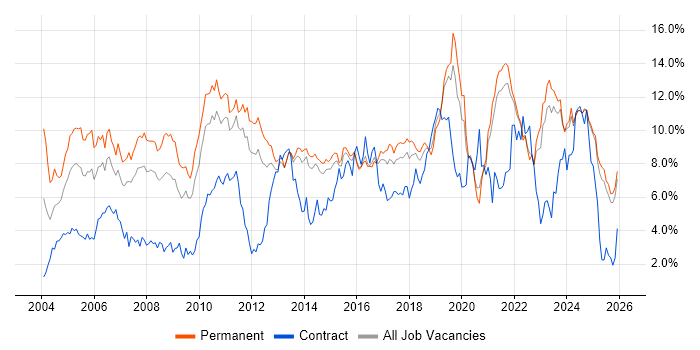
Job Vacancy Trend in Kent
Job postings that featured Senior in the job title as a proportion of all IT jobs advertised in Kent.

Senior
Salary Trend in Kent
3-month moving average salary quoted in jobs citing Senior in Kent.
Senior
Salary Histogram in Kent
Salary distribution for jobs citing Senior in Kent over the 6 months to 31 May 2025.
Senior
Job Locations in Kent
The table below looks at the demand and provides a guide to the median salaries quoted in IT jobs citing Senior within the Kent region over the 6 months to 31 May 2025. The 'Rank Change' column provides an indication of the change in demand within each location based on the same 6 month period last year.
| Location | Rank Change on Same Period Last Year |
Matching Permanent IT Job Ads |
Median Salary Past 6 Months |
Median Salary % Change on Same Period Last Year |
Live Jobs |
|---|---|---|---|---|---|
| Rochester | +8 | 69 | £55,000 | +18.92% | 6 |
| Tunbridge Wells | +13 | 7 | £65,000 | +4.00% | |
| Chatham | -3 | 4 | £77,500 | +19.23% | 3 |
| Maidstone | -4 | 4 | £70,000 | +21.74% | 8 |
| Dartford | +7 | 3 | - | - | 6 |
| Snodland | - | 3 | £39,000 | - | |
| Folkestone | 0 | 2 | - | - | |
| Gravesend | +6 | 1 | £70,500 | +12.80% | |
| Margate | - | 1 | £62,500 | - | |
| Canterbury | - | 1 | £47,500 | - | 2 |
| Senior South East |
|||||
Senior Skill Set
Top 30 Co-occurring Skills and Capabilities in Kent
For the 6 months to 31 May 2025, Senior job roles required the following skills and capabilities in order of popularity. The figures indicate the absolute number co-occurrences and as a proportion of all permanent job ads across the Kent region featuring Senior in the job title.
|
|
Senior Skill Set
Co-occurring Skills and Capabilities in Kent by Category
The follow tables expand on the table above by listing co-occurrences grouped by category. The same employment type, locality and period is covered with up to 20 co-occurrences shown in each of the following categories:
|
|
|||||||||||||||||||||||||||||||||||||||||||||||||||||||||||||||||||||||||||||||||||||||||||||||||||||||||||||||||||||
|
|
|||||||||||||||||||||||||||||||||||||||||||||||||||||||||||||||||||||||||||||||||||||||||||||||||||||||||||||||||||||
|
|
|||||||||||||||||||||||||||||||||||||||||||||||||||||||||||||||||||||||||||||||||||||||||||||||||||||||||||||||||||||
|
|
|||||||||||||||||||||||||||||||||||||||||||||||||||||||||||||||||||||||||||||||||||||||||||||||||||||||||||||||||||||
|
|
|||||||||||||||||||||||||||||||||||||||||||||||||||||||||||||||||||||||||||||||||||||||||||||||||||||||||||||||||||||
|
|
|||||||||||||||||||||||||||||||||||||||||||||||||||||||||||||||||||||||||||||||||||||||||||||||||||||||||||||||||||||
|
|
|||||||||||||||||||||||||||||||||||||||||||||||||||||||||||||||||||||||||||||||||||||||||||||||||||||||||||||||||||||
|
|
|||||||||||||||||||||||||||||||||||||||||||||||||||||||||||||||||||||||||||||||||||||||||||||||||||||||||||||||||||||
|
|
|||||||||||||||||||||||||||||||||||||||||||||||||||||||||||||||||||||||||||||||||||||||||||||||||||||||||||||||||||||
