Roadmaps Jobs in Leeds

Roadmaps
West Yorkshire > Leeds

The following table provides summary statistics for permanent job vacancies advertised in Leeds with a requirement for Roadmaps skills. Included is a benchmarking guide to the salaries offered in vacancies that have cited Roadmaps over the 6 months to 28 April 2024 with a comparison to the same period in the previous 2 years.

6 months to
28 Apr 2024
Same period 2023 Same period 2022
Rank 16 12 21
Rank change year-on-year -4 +9 +41
Permanent jobs citing Roadmaps 210 394 376
As % of all permanent jobs advertised in Leeds 9.23% 13.01% 9.99%
As % of the Processes & Methodologies category 10.62% 13.34% 10.26%
Number of salaries quoted 156 190 258
10th Percentile £37,500 £48,091 £41,500
25th Percentile £48,750 £61,180 £46,563
Median annual salary (50th Percentile) £79,632 £77,500 £60,000
Median % change year-on-year +2.75% +29.17% -4.00%
75th Percentile £95,000 £91,250 £77,500
90th Percentile £102,875 £110,379 £85,000
West Yorkshire median annual salary £75,000 £70,000 £60,000
% change year-on-year +7.14% +16.67% +5.05%

All Process and Methodology Skills
Leeds

Roadmaps is in the Processes and Methodologies category. The following table is for comparison with the above and provides summary statistics for all permanent job vacancies advertised in Leeds with a requirement for process or methodology skills.

Permanent vacancies with a requirement for process or methodology skills 1,977 2,953 3,665
As % of all permanent jobs advertised in Leeds 86.90% 97.49% 97.42%
Number of salaries quoted 1,399 1,707 2,551
10th Percentile £31,250 £34,423 £32,996
25th Percentile £41,000 £41,750 £42,500
Median annual salary (50th Percentile) £54,900 £56,500 £55,000
Median % change year-on-year -2.83% +2.73% +10.00%
75th Percentile £70,000 £75,000 £70,000
90th Percentile £84,964 £87,500 £85,000
West Yorkshire median annual salary £52,500 £55,000 £52,500
% change year-on-year -4.55% +4.76% +5.00%

Roadmaps
Job Vacancy Trend in Leeds

Job postings citing Roadmaps as a proportion of all IT jobs advertised in Leeds.
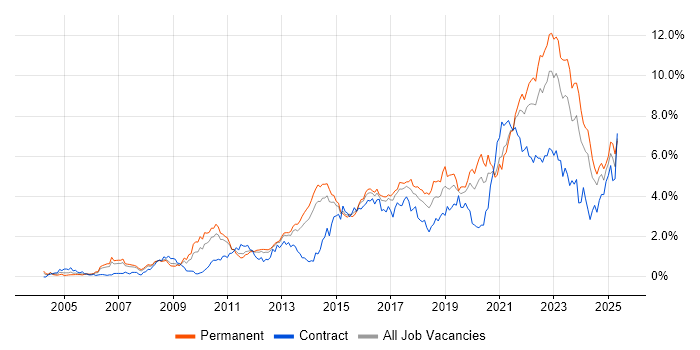
Job vacancy trend for Roadmaps in Leeds

Roadmaps
Salary Trend in Leeds

3-month moving average salary quoted in jobs citing Roadmaps in Leeds.

Salary trend for Roadmaps in Leeds

Roadmaps
Salary Histogram in Leeds

Salary distribution for jobs citing Roadmaps in Leeds over the 6 months to 28 April 2024.

Salary histogram for Roadmaps in Leeds

Roadmaps
Co-occurring Skills and Capabilities in Leeds by Category

The follow tables expand on the table above by listing co-occurrences grouped by category. The same employment type, locality and period is covered with up to 20 co-occurrences shown in each of the following categories:

Application Platforms
1 10 (4.76%) CMS
2 8 (3.81%) Confluence
3 4 (1.90%) SharePoint
4 2 (0.95%) Exchange Server 2013
4 2 (0.95%) Microsoft Exchange
4 2 (0.95%) Tuxedo
Applications
1 2 (0.95%) Trello
Business Applications
1 1 (0.48%) SAP ERP
1 1 (0.48%) SAP HCM
1 1 (0.48%) SAP HR
Cloud Services
1 42 (20.00%) Azure
2 40 (19.05%) AWS
3 26 (12.38%) GCP
4 13 (6.19%) Cloud Computing
5 11 (5.24%) Microsoft 365
6 8 (3.81%) Slack
6 8 (3.81%) Snowflake
7 7 (3.33%) Google Analytics
7 7 (3.33%) Google Tag Manager
8 5 (2.38%) Amazon S3
8 5 (2.38%) Firebase
8 5 (2.38%) OneDrive
8 5 (2.38%) SaaS
9 4 (1.90%) Amazon EC2
9 4 (1.90%) Amazon Kinesis
10 3 (1.43%) Dropbox
10 3 (1.43%) Facebook Ads
10 3 (1.43%) Google Ads
10 3 (1.43%) Google Drive
10 3 (1.43%) Microsoft Advertising
Communications & Networking
1 12 (5.71%) Firewall
2 11 (5.24%) VPN
3 8 (3.81%) WAN
4 6 (2.86%) DHCP
4 6 (2.86%) DNS
4 6 (2.86%) LAN
4 6 (2.86%) Network Security
4 6 (2.86%) SD-WAN
4 6 (2.86%) TCP/IP
5 5 (2.38%) Unified Communications
6 3 (1.43%) Wi-Fi
7 2 (0.95%) Intranet
7 2 (0.95%) Software-Defined Networking
7 2 (0.95%) Wireless
Database & Business Intelligence
1 16 (7.62%) Data Warehouse
2 13 (6.19%) NoSQL
3 11 (5.24%) Data Lake
4 9 (4.29%) Tableau
5 7 (3.33%) BigQuery
5 7 (3.33%) Looker
6 5 (2.38%) Amazon RDS
6 5 (2.38%) Amazon Redshift
6 5 (2.38%) Elasticsearch
6 5 (2.38%) Redis
7 4 (1.90%) MySQL
7 4 (1.90%) RDBMS
7 4 (1.90%) Relational Database
7 4 (1.90%) SQL Server
7 4 (1.90%) SQL Server Integration Services
8 3 (1.43%) Power BI
9 2 (0.95%) Azure SQL Data Warehouse
9 2 (0.95%) GIS
9 2 (0.95%) SQL Server Analysis Services
10 1 (0.48%) QualityStage
Development Applications
1 16 (7.62%) JIRA
2 13 (6.19%) Git
3 8 (3.81%) CircleCI
3 8 (3.81%) Cucumber
3 8 (3.81%) GitLab
3 8 (3.81%) Jenkins
3 8 (3.81%) JUnit
3 8 (3.81%) Selenium
4 5 (2.38%) Cypress.io
5 4 (1.90%) Postman
6 1 (0.48%) Bitbucket
6 1 (0.48%) Visual Studio Code
General
1 74 (35.24%) Finance
2 55 (26.19%) Social Skills
3 23 (10.95%) Banking
4 22 (10.48%) Public Sector
5 16 (7.62%) Marketing
6 14 (6.67%) Legal
7 10 (4.76%) Analytical Skills
8 8 (3.81%) Pharmaceutical
9 6 (2.86%) Retail
10 5 (2.38%) Tech for Good
11 4 (1.90%) Influencing Skills
11 4 (1.90%) Law
11 4 (1.90%) Organisational Skills
11 4 (1.90%) Presentation Skills
12 3 (1.43%) Advertising
12 3 (1.43%) Inclusion and Diversity
13 1 (0.48%) Financial Institution
13 1 (0.48%) Local Government
13 1 (0.48%) Manufacturing
Job Titles
1 81 (38.57%) Architect
2 32 (15.24%) Lead
3 27 (12.86%) Senior
4 22 (10.48%) Solutions Architect
5 20 (9.52%) Enterprise Architect
6 16 (7.62%) Senior Architect
7 13 (6.19%) IT Architect
7 13 (6.19%) Senior Solutions Architect
8 12 (5.71%) Data Architect
9 11 (5.24%) Chief Architect
9 11 (5.24%) Technical Leader
10 10 (4.76%) Cloud Engineer
10 10 (4.76%) Engineering Manager
11 9 (4.29%) Analyst
11 9 (4.29%) Consultant
11 9 (4.29%) Principal Cloud Engineer
11 9 (4.29%) Principal Engineer
12 8 (3.81%) Head of IT
12 8 (3.81%) Head of IT Services
13 7 (3.33%) Analytics Manager
Libraries, Frameworks & Software Standards
1 10 (4.76%) RESTful
2 5 (2.38%) AngularJS
2 5 (2.38%) CSS
2 5 (2.38%) Jest
2 5 (2.38%) Middleware
2 5 (2.38%) React
2 5 (2.38%) Svelte
2 5 (2.38%) Tailwind CSS
2 5 (2.38%) Twitter Bootstrap
2 5 (2.38%) Vue
3 4 (1.90%) JSON
3 4 (1.90%) Spring
3 4 (1.90%) Spring Boot
4 3 (1.43%) .NET
5 2 (0.95%) Node.js
6 1 (0.48%) Software Packaging
Miscellaneous
1 21 (10.00%) Mobile App
2 14 (6.67%) Data Centre
3 11 (5.24%) Product Ownership
4 10 (4.76%) Cloud Native
4 10 (4.76%) Management Information System
5 8 (3.81%) NHS
5 8 (3.81%) Public Cloud
6 6 (2.86%) Enterprise Software
7 5 (2.38%) Analytical Mindset
7 5 (2.38%) Digital Signage
7 5 (2.38%) PMI
7 5 (2.38%) Video Conferencing
8 3 (1.43%) Blog
8 3 (1.43%) iPad
8 3 (1.43%) PropTech
9 1 (0.48%) Renewable Energy
Operating Systems
1 13 (6.19%) Linux
1 13 (6.19%) Windows
2 4 (1.90%) Apple iOS
3 3 (1.43%) Android
4 1 (0.48%) VME
4 1 (0.48%) Windows Server
4 1 (0.48%) Windows Server 2012
4 1 (0.48%) Windows Server 2016
4 1 (0.48%) Windows Server 2019
Processes & Methodologies
1 85 (40.48%) Agile
2 39 (18.57%) DevOps
3 36 (17.14%) Project Management
3 36 (17.14%) Technology Roadmap
4 35 (16.67%) IT Strategy
5 33 (15.71%) Mentoring
5 33 (15.71%) Problem-Solving
6 29 (13.81%) Coaching
7 28 (13.33%) Microservices
7 28 (13.33%) Product Roadmap
8 23 (10.95%) CI/CD
9 21 (10.00%) Analytics
9 21 (10.00%) Business Strategy
9 21 (10.00%) Data Governance
9 21 (10.00%) Enterprise Architecture
9 21 (10.00%) Scrum
10 20 (9.52%) Data Management
11 19 (9.05%) TOGAF
12 18 (8.57%) Data Architecture
12 18 (8.57%) Stakeholder Management
Programming Languages
1 30 (14.29%) SQL
2 10 (4.76%) Python
3 7 (3.33%) JavaScript
3 7 (3.33%) TypeScript
4 6 (2.86%) COBOL
4 6 (2.86%) Java
4 6 (2.86%) Micro Focus COBOL
5 5 (2.38%) C#
6 4 (1.90%) PHP
7 3 (1.43%) C
7 3 (1.43%) C++
7 3 (1.43%) Kotlin
7 3 (1.43%) Swift
8 1 (0.48%) PowerShell
Qualifications
1 17 (8.10%) Degree
2 13 (6.19%) TOGAF Certification
3 10 (4.76%) Computer Science Degree
4 8 (3.81%) CIPD
4 8 (3.81%) DBS Check
5 7 (3.33%) Azure Certification
6 5 (2.38%) APMP
6 5 (2.38%) CAPM
6 5 (2.38%) CISSP
6 5 (2.38%) Microsoft Certification
6 5 (2.38%) PgMP
6 5 (2.38%) PMI Certification
6 5 (2.38%) PMP
6 5 (2.38%) Security Cleared
7 3 (1.43%) OCP
7 3 (1.43%) Oracle Certification
7 3 (1.43%) SC Cleared
8 2 (0.95%) AWS Certification
8 2 (0.95%) CCIE
8 2 (0.95%) Cisco Certification
Quality Assurance & Compliance
1 9 (4.29%) GDPR
2 8 (3.81%) PSD2
3 6 (2.86%) Data Quality
4 5 (2.38%) ISO/IEC 27001
4 5 (2.38%) QA
5 2 (0.95%) COBIT
5 2 (0.95%) GRC
6 1 (0.48%) Cyber Essentials
6 1 (0.48%) PMO
6 1 (0.48%) Sarbanes-Oxley
6 1 (0.48%) SOC 2
System Software
1 11 (5.24%) Hyper-V
2 8 (3.81%) Active Directory
3 6 (2.86%) VMware Infrastructure
4 1 (0.48%) Microsoft App-V
Systems Management
1 9 (4.29%) Kubernetes
2 5 (2.38%) Grafana
2 5 (2.38%) Prometheus
2 5 (2.38%) SCOM
3 4 (1.90%) Terraform
4 1 (0.48%) Jamf Pro
4 1 (0.48%) SCCM
Vendors
1 43 (20.48%) Microsoft
2 21 (10.00%) Google
3 10 (4.76%) Oracle
4 8 (3.81%) Cisco
4 8 (3.81%) Duck Creek
5 7 (3.33%) Databricks
5 7 (3.33%) SAP
6 6 (2.86%) Micro Focus
6 6 (2.86%) VMware
7 5 (2.38%) SolarWinds
8 3 (1.43%) Facebook
8 3 (1.43%) Meraki
9 2 (0.95%) Palo Alto
9 2 (0.95%) Salesforce
9 2 (0.95%) ServiceNow
10 1 (0.48%) BT
10 1 (0.48%) Workday