Windows Jobs in Leeds

Microsoft Windows
West Yorkshire > Leeds

The following table provides summary statistics for permanent job vacancies advertised in Leeds with a requirement for Windows skills. Included is a benchmarking guide to the salaries offered in vacancies that have cited Windows over the 6 months to 28 April 2024 with a comparison to the same period in the previous 2 years.

6 months to
28 Apr 2024
Same period 2023 Same period 2022
Rank 22 42 27
Rank change year-on-year +20 -15 -5
Permanent jobs citing Windows 188 194 316
As % of all permanent jobs advertised in Leeds 8.26% 6.40% 8.40%
As % of the Operating Systems category 72.03% 56.23% 44.89%
Number of salaries quoted 160 143 235
10th Percentile £29,750 £24,280 £24,000
25th Percentile £36,250 £27,250 £29,000
Median annual salary (50th Percentile) £50,000 £42,500 £42,500
Median % change year-on-year +17.65% - +13.33%
75th Percentile £61,938 £57,500 £55,625
90th Percentile £65,625 £72,500 £66,350
West Yorkshire median annual salary £42,500 £40,113 £36,750
% change year-on-year +5.95% +9.15% -8.13%

All Operating Systems
Leeds

Windows is in the Operating Systems category. The following table is for comparison with the above and provides summary statistics for all permanent job vacancies advertised in Leeds with a requirement for operating system skills.

Permanent vacancies with a requirement for operating system skills 261 345 704
As % of all permanent jobs advertised in Leeds 11.47% 11.39% 18.71%
Number of salaries quoted 203 229 478
10th Percentile £31,050 £25,196 £26,250
25th Percentile £39,445 £35,000 £36,250
Median annual salary (50th Percentile) £50,000 £47,500 £52,375
Median % change year-on-year +5.26% -9.31% +10.26%
75th Percentile £63,250 £65,000 £65,000
90th Percentile £67,500 £84,000 £74,825
West Yorkshire median annual salary £46,000 £45,000 £45,000
% change year-on-year +2.22% - -5.26%

Windows
Job Vacancy Trend in Leeds

Job postings citing Windows as a proportion of all IT jobs advertised in Leeds.
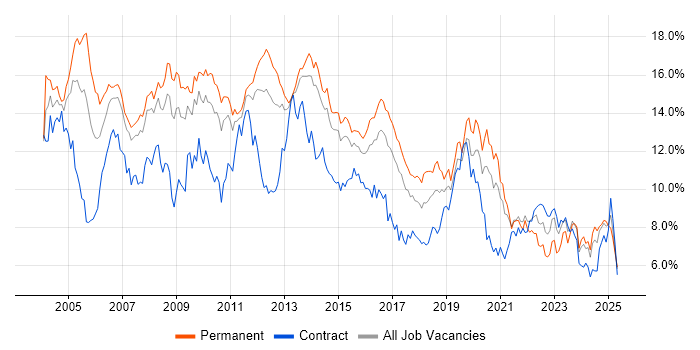
Job vacancy trend for Windows in Leeds

Windows
Salary Trend in Leeds

3-month moving average salary quoted in jobs citing Windows in Leeds.

Salary trend for Windows in Leeds

Windows
Salary Histogram in Leeds

Salary distribution for jobs citing Windows in Leeds over the 6 months to 28 April 2024.

Salary histogram for Windows in Leeds

Windows
Co-occurring Skills and Capabilities in Leeds by Category

The follow tables expand on the table above by listing co-occurrences grouped by category. The same employment type, locality and period is covered with up to 20 co-occurrences shown in each of the following categories:

Application Platforms
1 21 (11.17%) Microsoft Exchange
2 17 (9.04%) SharePoint
3 8 (4.26%) IIS
4 5 (2.66%) Apache
5 2 (1.06%) Exchange Server 2010
6 1 (0.53%) Confluence
Applications
1 15 (7.98%) Microsoft Office
2 1 (0.53%) Microsoft Excel
2 1 (0.53%) Microsoft PowerPoint
2 1 (0.53%) Microsoft Project
2 1 (0.53%) MS Visio
Cloud Services
1 87 (46.28%) Azure
2 79 (42.02%) Microsoft 365
3 44 (23.40%) Entra ID
4 37 (19.68%) OneDrive
5 20 (10.64%) AWS
6 8 (4.26%) GCP
7 7 (3.72%) Azure DevOps
7 7 (3.72%) IaaS
7 7 (3.72%) SaaS
8 5 (2.66%) Amazon S3
8 5 (2.66%) Azure Sentinel
8 5 (2.66%) Cloud Computing
8 5 (2.66%) Snowflake
9 4 (2.13%) PaaS
10 3 (1.60%) Azure Monitor
10 3 (1.60%) OpenShift
10 3 (1.60%) Power Platform
11 2 (1.06%) Azure Key Vault
11 2 (1.06%) Google Workspace
11 2 (1.06%) Mimecast
Communications & Networking
1 63 (33.51%) Firewall
2 39 (20.74%) SAN
3 37 (19.68%) DNS
4 36 (19.15%) LAN
4 36 (19.15%) WAN
5 33 (17.55%) DHCP
6 32 (17.02%) NAS
7 30 (15.96%) VPN
8 19 (10.11%) VLAN
9 17 (9.04%) TCP/IP
10 14 (7.45%) Internet
11 11 (5.85%) SSL
11 11 (5.85%) Wi-Fi
12 9 (4.79%) Network Security
13 8 (4.26%) SD-WAN
14 5 (2.66%) IPsec
14 5 (2.66%) SNMP
14 5 (2.66%) Unified Communications
15 3 (1.60%) Intrusion Detection
15 3 (1.60%) VoIP
Database & Business Intelligence
1 19 (10.11%) SQL Server
2 12 (6.38%) Elasticsearch
3 7 (3.72%) MongoDB
3 7 (3.72%) NoSQL
4 5 (2.66%) Redis
5 4 (2.13%) MySQL
6 3 (1.60%) Power BI
7 2 (1.06%) Apache Cassandra
7 2 (1.06%) Azure SQL Database
7 2 (1.06%) Data Warehouse
7 2 (1.06%) PostgreSQL
8 1 (0.53%) InfluxDB
8 1 (0.53%) Oracle Database
8 1 (0.53%) RDBMS
8 1 (0.53%) Relational Database
Development Applications
1 4 (2.13%) IBM UrbanCode
2 3 (1.60%) Atlassian Bamboo
2 3 (1.60%) Bitbucket
3 1 (0.53%) GitLab
3 1 (0.53%) Jenkins
3 1 (0.53%) JIRA
3 1 (0.53%) SonarQube
General
1 54 (28.72%) Social Skills
2 31 (16.49%) Law
3 24 (12.77%) Finance
4 14 (7.45%) Analytical Skills
5 10 (5.32%) Organisational Skills
6 7 (3.72%) Marketing
6 7 (3.72%) Retail
7 5 (2.66%) Banking
8 4 (2.13%) Presentation Skills
9 3 (1.60%) Games
10 2 (1.06%) Documentation Skills
11 1 (0.53%) Automotive
11 1 (0.53%) Legal
11 1 (0.53%) Manufacturing
11 1 (0.53%) Public Sector
11 1 (0.53%) Publishing
11 1 (0.53%) Retail Banking
Job Titles
1 33 (17.55%) Infrastructure Specialist
2 25 (13.30%) Infrastructure Engineer
3 24 (12.77%) Lead
4 22 (11.70%) IT Support
5 20 (10.64%) Analyst
6 18 (9.57%) Support Engineer
7 17 (9.04%) IT Engineer
8 12 (6.38%) Consultant
8 12 (6.38%) Senior
9 11 (5.85%) IT Manager
10 10 (5.32%) Azure Engineer
10 10 (5.32%) IT Support Engineer
10 10 (5.32%) Technical Support
11 9 (4.79%) 2nd Line Support
11 9 (4.79%) Support Analyst
12 8 (4.26%) Azure Specialist
12 8 (4.26%) Support Technician
13 7 (3.72%) Azure Infrastructure Lead
13 7 (3.72%) Field Support Technician
13 7 (3.72%) IT Infrastructure Engineer
Libraries, Frameworks & Software Standards
1 9 (4.79%) Middleware
2 5 (2.66%) .NET
2 5 (2.66%) RabbitMQ
2 5 (2.66%) YAML
3 3 (1.60%) ADO
3 3 (1.60%) AngularJS
3 3 (1.60%) ASP.NET
3 3 (1.60%) ASP.NET MVC
3 3 (1.60%) CSS
3 3 (1.60%) Elastic Stack
3 3 (1.60%) HTML
3 3 (1.60%) jQuery
3 3 (1.60%) React
3 3 (1.60%) REST
3 3 (1.60%) Software Packaging
3 3 (1.60%) Tailwind CSS
3 3 (1.60%) Twitter Bootstrap
3 3 (1.60%) Vue
3 3 (1.60%) WPF
4 1 (0.53%) JWT
Miscellaneous
1 28 (14.89%) Data Centre
2 14 (7.45%) Public Cloud
3 9 (4.79%) Cyberattack
3 9 (4.79%) Management Information System
4 8 (4.26%) Self-Motivation
5 6 (3.19%) Onboarding
5 6 (3.19%) Operational Technology
5 6 (3.19%) SCADA
6 4 (2.13%) Replication
7 3 (1.60%) Linux Command Line
7 3 (1.60%) Wiki
8 2 (1.06%) Client/Server
8 2 (1.06%) CMDB
8 2 (1.06%) Driving Licence
8 2 (1.06%) Hybrid Cloud
9 1 (0.53%) Blackberry
9 1 (0.53%) Cyber Threat
9 1 (0.53%) iPhone
9 1 (0.53%) Mainframe
9 1 (0.53%) New Media
Operating Systems
1 111 (59.04%) Windows Server
2 81 (43.09%) Linux
3 22 (11.70%) Windows Server 2008
4 19 (10.11%) Windows 10
5 14 (7.45%) Windows Server 2012
6 11 (5.85%) Windows Server 2016
7 10 (5.32%) Mac OS
7 10 (5.32%) Red Hat Enterprise Linux
8 9 (4.79%) Windows Server 2019
9 7 (3.72%) Unix
10 5 (2.66%) Data ONTAP
11 4 (2.13%) Apple iOS
11 4 (2.13%) Mac OS X
12 3 (1.60%) CentOS
13 2 (1.06%) VMS
14 1 (0.53%) CoreOS
14 1 (0.53%) zOS
Processes & Methodologies
1 50 (26.60%) Infrastructure Engineering
2 38 (20.21%) Problem-Solving
3 31 (16.49%) Customer Service
4 30 (15.96%) Migration
5 26 (13.83%) ITIL
6 25 (13.30%) Mentoring
7 18 (9.57%) DevOps
7 18 (9.57%) Time Management
8 16 (8.51%) Infrastructure Management
8 16 (8.51%) Preventative Maintenance
9 15 (7.98%) Agile
9 15 (7.98%) Technical Leadership
10 14 (7.45%) Project Management
11 13 (6.91%) Containerisation
11 13 (6.91%) Network Design
11 13 (6.91%) Roadmaps
11 13 (6.91%) Service Management
12 12 (6.38%) Computer Science
12 12 (6.38%) Continuous Improvement
13 11 (5.85%) Incident Response
Programming Languages
1 30 (15.96%) PowerShell
2 27 (14.36%) SQL
3 19 (10.11%) Python
4 10 (5.32%) VBScript
5 3 (1.60%) Bash
5 3 (1.60%) C#
5 3 (1.60%) Groovy
5 3 (1.60%) Ruby
5 3 (1.60%) XAML
6 2 (1.06%) Kusto Query Language
7 1 (0.53%) T-SQL
Qualifications
1 26 (13.83%) Degree
2 18 (9.57%) Microsoft Certification
3 12 (6.38%) Computer Science Degree
4 9 (4.79%) MCSE
5 8 (4.26%) CCNA
5 8 (4.26%) Cisco Certification
6 7 (3.72%) MCP
6 7 (3.72%) MCSA
7 5 (2.66%) Azure Certification
7 5 (2.66%) CISSP
7 5 (2.66%) DBS Check
7 5 (2.66%) SC Cleared
7 5 (2.66%) Security Cleared
7 5 (2.66%) TOGAF Certification
8 4 (2.13%) A+ Certification
8 4 (2.13%) ITIL Foundation Certificate
9 2 (1.06%) CEH
9 2 (1.06%) CompTIA Security+
9 2 (1.06%) OSCP
9 2 (1.06%) SSCP
Quality Assurance & Compliance
1 7 (3.72%) SLA
2 4 (2.13%) ISO/IEC 27001
3 2 (1.06%) Cyber Essentials
3 2 (1.06%) Sarbanes-Oxley
4 1 (0.53%) SOC 2
System Software
1 93 (49.47%) Active Directory
2 58 (30.85%) Hyper-V
3 49 (26.06%) VMware Infrastructure
4 30 (15.96%) VMware ESXi
5 11 (5.85%) Docker
6 10 (5.32%) vSphere
7 7 (3.72%) Virtual Machines
8 3 (1.60%) Microsoft App-V
9 1 (0.53%) Virtual Desktop
9 1 (0.53%) VMware Server
Systems Management
1 21 (11.17%) vCenter Server
2 19 (10.11%) Ansible
3 16 (8.51%) Kubernetes
3 16 (8.51%) SCCM
4 13 (6.91%) Prometheus
4 13 (6.91%) SCOM
5 11 (5.85%) Terraform
5 11 (5.85%) WSUS
6 9 (4.79%) Microsoft Intune
7 8 (4.26%) Grafana
8 7 (3.72%) FortiGate
9 6 (3.19%) Microsoft Data Protection Manager
9 6 (3.19%) Nagios
10 5 (2.66%) Jamf Pro
11 4 (2.13%) Backup Exec
11 4 (2.13%) Puppet
12 3 (1.60%) Progress Chef
13 2 (1.06%) CSIRT
13 2 (1.06%) Kibana
13 2 (1.06%) logstash
Vendors
1 76 (40.43%) Microsoft
1 76 (40.43%) VMware
2 26 (13.83%) Veeam
3 22 (11.70%) Cisco
4 14 (7.45%) Red Hat
5 13 (6.91%) Oracle
6 9 (4.79%) CheckPoint
6 9 (4.79%) IBM
6 9 (4.79%) NetApp
7 7 (3.72%) Epicor
7 7 (3.72%) Meraki
7 7 (3.72%) SolarWinds
8 6 (3.19%) Google
8 6 (3.19%) Splunk
9 5 (2.66%) Datto
9 5 (2.66%) Palo Alto
9 5 (2.66%) SolidFire
10 4 (2.13%) Citrix
10 4 (2.13%) Veritas
11 3 (1.60%) Dell