Aruba
Tyne and Wear > Newcastle upon Tyne
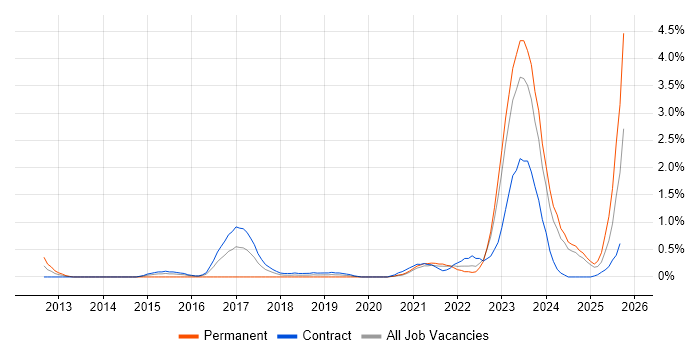
The table below provides summary statistics for permanent job vacancies advertised in Newcastle upon Tyne requiring knowledge or experience of Aruba products and/or services. It includes a benchmarking guide to the annual salaries offered in vacancies that cited Aruba over the 6 months leading up to 14 October 2025, comparing them to the same period in the previous two years.
The figures below represent the IT labour market in general and are not representative of salaries within Aruba Networks.
|
|
6 months to
14 Oct 2025 |
Same period 2024 |
Same period 2023 |
| Rank |
50 |
55 |
28 |
| Rank change year-on-year |
+5 |
-27 |
- |
| Permanent jobs citing Aruba |
3 |
9 |
16 |
| As % of all permanent jobs in Newcastle upon Tyne |
0.61% |
1.21% |
5.32% |
| As % of the Vendors category |
1.40% |
3.81% |
11.76% |
| Number of salaries quoted |
2 |
3 |
16 |
| 10th Percentile |
£48,775 |
£52,750 |
£36,750 |
| 25th Percentile |
£52,938 |
£53,125 |
£37,875 |
| Median annual salary (50th Percentile) |
£61,750 |
£57,500 |
£39,794 |
| Median % change year-on-year |
+7.39% |
+44.49% |
- |
| 75th Percentile |
£72,438 |
£73,750 |
£41,000 |
| 90th Percentile |
£77,725 |
£81,250 |
£41,500 |
| Tyne and Wear median annual salary |
£61,750 |
£57,500 |
£39,794 |
| % change year-on-year |
+7.39% |
+44.49% |
- |
Aruba falls under the Vendor Products and Services category. For comparison with the information above, the following table provides summary statistics for all permanent job vacancies requiring knowledge or experience of all vendor products and services in Newcastle upon Tyne.
| Permanent vacancies with a requirement for knowledge or experience of vendor products and services |
215 |
236 |
136 |
| As % of all permanent jobs advertised in Newcastle upon Tyne |
43.43% |
31.64% |
45.18% |
| Number of salaries quoted |
100 |
97 |
119 |
| 10th Percentile |
£26,625 |
£31,250 |
£31,250 |
| 25th Percentile |
£28,500 |
£35,500 |
£38,629 |
| Median annual salary (50th Percentile) |
£41,250 |
£45,000 |
£50,000 |
| Median % change year-on-year |
-8.33% |
-10.00% |
- |
| 75th Percentile |
£65,000 |
£67,500 |
£63,125 |
| 90th Percentile |
£71,250 |
£75,000 |
£85,000 |
| Tyne and Wear median annual salary |
£35,000 |
£43,387 |
£49,557 |
| % change year-on-year |
-19.33% |
-12.45% |
+8.32% |


