Architect Job Trends in Newcastle upon Tyne

Architect
Tyne and Wear > Newcastle upon Tyne

The median Architect salary in Newcastle upon Tyne is £80,000 per year, according to job vacancies posted during the 6 months leading to 11 October 2026.

The table below compares current salary benchmarking and summary statistics with the previous two years.

6 months to
11 Oct 2026
Same period 2025 Same period 2024
Rank 23 25 20
Rank change year-on-year +2 -5 -5
Permanent jobs requiring an Architect 154 28 51
As % of all permanent jobs in Newcastle upon Tyne 6.97% 5.63% 6.69%
As % of the Job Titles category 7.25% 5.83% 6.85%
Number of salaries quoted 112 26 28
10th Percentile £65,000 £61,125 £59,043
25th Percentile £70,000 £62,500 £60,000
Median annual salary (50th Percentile) £80,000 £72,500 £70,000
Median % change year-on-year +10.34% +3.57% -17.65%
75th Percentile £91,860 £81,250 £85,000
90th Percentile £95,000 £100,000 -
Tyne and Wear median annual salary £80,000 £67,500 £70,000
% change year-on-year +18.52% -3.57% -17.65%

All Permanent IT Job Roles
Newcastle upon Tyne

For comparison with the information above, the following table provides summary statistics for all permanent IT job vacancies in Newcastle upon Tyne. Most job vacancies include a discernible job title that can be normalized. As such, the figures in the second row provide an indication of the number of permanent jobs in our overall sample.

Permanent vacancies in Newcastle upon Tyne with a recognized job title 2,124 480 745
% of permanent jobs with a recognized job title 96.15% 96.58% 97.77%
Number of salaries quoted 1,645 319 383
10th Percentile £37,500 £25,179 £30,000
25th Percentile £45,000 £28,500 £36,250
Median annual salary (50th Percentile) £58,000 £45,000 £50,000
Median % change year-on-year +28.89% -10.00% -9.09%
75th Percentile £75,000 £63,750 £70,000
90th Percentile £95,000 £75,000 £85,000
Tyne and Wear median annual salary £55,000 £45,000 £45,000
% change year-on-year +22.22% - -14.29%

Architect
Job Vacancy Trend in Newcastle upon Tyne

Historical trend showing the proportion of permanent IT job postings featuring 'Architect' in the job title relative to all permanent IT jobs advertised in Newcastle upon Tyne.
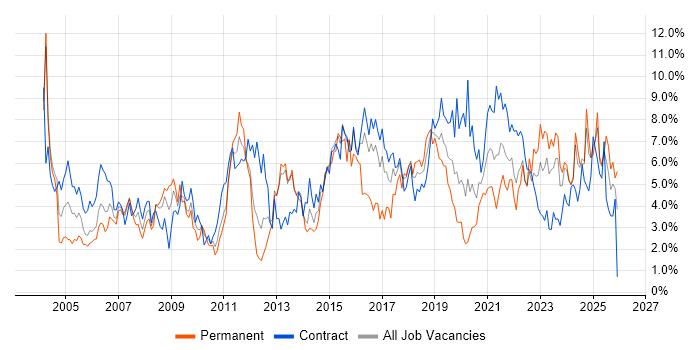
Architect job vacancy trend in Newcastle upon Tyne

Architect
Salary Trend in Newcastle upon Tyne

Salary distribution trend for Architect job vacancies in Newcastle upon Tyne.
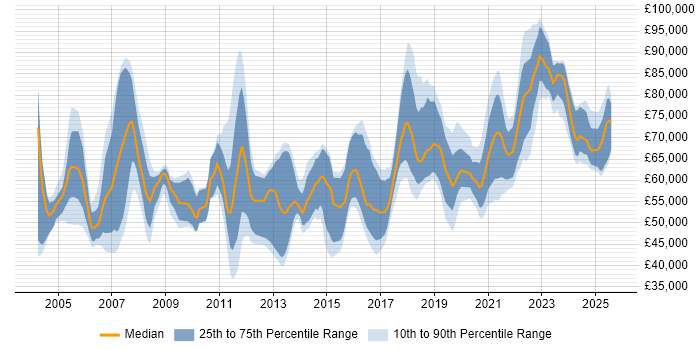
Salary distribution trend for Architect job vacancies in Newcastle upon Tyne

Architect
Salary Histogram in Newcastle upon Tyne

Salary distribution for jobs citing Architect in Newcastle upon Tyne over the 6 months to 11 October 2026.

Salary histogram for Architect in Newcastle upon Tyne

Architect Skill Set
Top 30 Co-Occurring Skills & Capabilities in Newcastle upon Tyne

For the 6 months to 11 October 2026, Architect job roles required the following skills and capabilities in order of popularity. The figures indicate the absolute number of co-occurrences and as a proportion of all permanent job ads across the Newcastle upon Tyne region featuring Architect in the job title.

1 31 (20.13%) Agile
2 30 (19.48%) Azure
3 27 (17.53%) Roadmaps
4 26 (16.88%) AI
4 26 (16.88%) CI/CD
4 26 (16.88%) Technical Architecture
5 23 (14.94%) AWS
5 23 (14.94%) Data Architecture
6 22 (14.29%) Mentoring
7 20 (12.99%) Architecture Governance
7 20 (12.99%) Continuous Improvement
7 20 (12.99%) Decision-Making
7 20 (12.99%) Stakeholder Engagement
8 18 (11.69%) Data Modelling
9 15 (9.74%) Analytics
10 14 (9.09%) Architectural Patterns
10 14 (9.09%) DevOps
10 14 (9.09%) Digital Transformation Programme
10 14 (9.09%) Microsoft
11 13 (8.44%) Data Engineering
11 13 (8.44%) Enterprise Architecture
12 12 (7.79%) Azure Certification
12 12 (7.79%) Coaching
13 11 (7.14%) Security Cleared
13 11 (7.14%) Strategic Thinking
13 11 (7.14%) Technical Leadership
13 11 (7.14%) Waterfall
14 10 (6.49%) GCP
14 10 (6.49%) Infrastructure as Code
14 10 (6.49%) Integration Patterns

Architect Skill Set
Co-Occurring Skills & Capabilities in Newcastle upon Tyne by Category

The following tables expand on the one above by listing co-occurrences grouped by category. They cover the same employment type, locality and period, with up to 20 co-occurrences shown in each category:

Application Platforms
1 2 (1.30%) SharePoint
2 1 (0.65%) Oracle SOA Suite
2 1 (0.65%) WebSphere
Applications
1 3 (1.95%) Chatbot
Business Applications
1 1 (0.65%) Infor CloudSuite
1 1 (0.65%) Infor M3
Cloud Services
1 30 (19.48%) Azure
2 23 (14.94%) AWS
3 10 (6.49%) GCP
4 7 (4.55%) Power Platform
5 5 (3.25%) IaaS
5 5 (3.25%) SaaS
6 4 (2.60%) PaaS
7 3 (1.95%) Azure AI
7 3 (1.95%) Azure Cosmos DB
7 3 (1.95%) Azure Data Factory
7 3 (1.95%) Microsoft 365
7 3 (1.95%) Microsoft Copilot
8 2 (1.30%) Azure Monitor
8 2 (1.30%) Microsoft Purview
8 2 (1.30%) OneDrive
9 1 (0.65%) Copilot Studio
9 1 (0.65%) Serverless
9 1 (0.65%) Vertex AI
Communications & Networking
1 3 (1.95%) CTI
1 3 (1.95%) VoIP
2 1 (0.65%) Network Security
Database & Business Intelligence
1 7 (4.55%) Power BI
2 6 (3.90%) Metadata
3 4 (2.60%) MongoDB
3 4 (2.60%) MySQL
3 4 (2.60%) NoSQL
3 4 (2.60%) PostgreSQL
3 4 (2.60%) Tableau
4 3 (1.95%) Azure SQL Database
4 3 (1.95%) Data Lake
5 1 (0.65%) Metadata Repository
Development Applications
1 1 (0.65%) Claude Code
General
1 49 (31.82%) Public Sector
2 21 (13.64%) Social Skills
3 20 (12.99%) Inclusion and Diversity
4 12 (7.79%) Finance
4 12 (7.79%) Legal
5 10 (6.49%) Analytical Skills
5 10 (6.49%) Military
6 8 (5.19%) Retail
7 6 (3.90%) Influencing Skills
8 5 (3.25%) Manufacturing
9 2 (1.30%) Banking
Libraries, Frameworks & Software Standards
1 6 (3.90%) LangChain
1 6 (3.90%) LlamaIndex
2 3 (1.95%) Middleware
3 2 (1.30%) .NET
4 1 (0.65%) EDI
4 1 (0.65%) Langfuse
4 1 (0.65%) Model Context Protocol
4 1 (0.65%) WebSphere MQ
Miscellaneous
1 17 (11.04%) Cloud Native
2 6 (3.90%) Enterprise Software
2 6 (3.90%) Onboarding
3 4 (2.60%) Distributed Architecture
3 4 (2.60%) Distributed Computing
4 3 (1.95%) IVR
5 2 (1.30%) Data Structures
5 2 (1.30%) FMCG
5 2 (1.30%) Robotics
5 2 (1.30%) Virtual Team
6 1 (0.65%) AI Agents
6 1 (0.65%) Data Protection Act
6 1 (0.65%) Legacy Applications
Operating Systems
1 2 (1.30%) Linux
1 2 (1.30%) Windows
Processes & Methodologies
1 31 (20.13%) Agile
2 27 (17.53%) Roadmaps
3 26 (16.88%) AI
3 26 (16.88%) CI/CD
3 26 (16.88%) Technical Architecture
4 23 (14.94%) Data Architecture
5 22 (14.29%) Mentoring
6 20 (12.99%) Architecture Governance
6 20 (12.99%) Continuous Improvement
6 20 (12.99%) Decision-Making
6 20 (12.99%) Stakeholder Engagement
7 18 (11.69%) Data Modelling
8 15 (9.74%) Analytics
9 14 (9.09%) Architectural Patterns
9 14 (9.09%) DevOps
9 14 (9.09%) Digital Transformation Programme
10 13 (8.44%) Data Engineering
10 13 (8.44%) Enterprise Architecture
11 12 (7.79%) Coaching
12 11 (7.14%) Strategic Thinking
Programming Languages
1 7 (4.55%) SQL
2 4 (2.60%) Python
2 4 (2.60%) Scala
3 1 (0.65%) C#
Qualifications
1 12 (7.79%) Azure Certification
2 11 (7.14%) Security Cleared
3 9 (5.84%) Degree
4 8 (5.19%) AWS Certification
5 4 (2.60%) Computer Science Degree
6 3 (1.95%) TOGAF Certification
7 2 (1.30%) SC Cleared
8 1 (0.65%) (ISC)2 CCSP
8 1 (0.65%) CCSP
8 1 (0.65%) Cisco Certification
8 1 (0.65%) CISM
8 1 (0.65%) CISSP
8 1 (0.65%) Microsoft Certified Professional
Quality Assurance & Compliance
1 5 (3.25%) Data Quality
2 4 (2.60%) Accessibility
3 2 (1.30%) ISO/IEC 27001
4 1 (0.65%) ISO 9001
4 1 (0.65%) NIST
4 1 (0.65%) QA
System Software
1 1 (0.65%) Docker
Systems Management
1 1 (0.65%) Kubernetes
Vendors
1 14 (9.09%) Microsoft
2 5 (3.25%) Oracle
3 3 (1.95%) Avaya
3 3 (1.95%) Cisco
3 3 (1.95%) Genesys
4 2 (1.30%) Adobe
4 2 (1.30%) Google
5 1 (0.65%) IBM
5 1 (0.65%) Infor
5 1 (0.65%) MuleSoft
5 1 (0.65%) Pega
5 1 (0.65%) Salesforce