Containerisation Jobs in Nottingham

Containerization
Nottinghamshire > Nottingham

The table below provides summary statistics for permanent job vacancies advertised in Nottingham requiring Containerisation skills. It includes a benchmarking guide to the annual salaries offered in vacancies that cited Containerisation over the 6 months leading up to 12 December 2024, comparing them to the same period in the previous two years.

6 months to
12 Dec 2024
Same period 2023 Same period 2022
Rank 55 37 67
Rank change year-on-year -18 +30 -16
Permanent jobs citing Containerisation 12 8 30
As % of all permanent jobs advertised in Nottingham 1.99% 3.19% 3.80%
As % of the Processes & Methodologies category 2.22% 3.57% 3.95%
Number of salaries quoted 9 2 24
10th Percentile £33,750 £55,125 £62,500
25th Percentile £36,250 £55,313 £64,375
Median annual salary (50th Percentile) £42,500 £56,250 £70,000
Median % change year-on-year -24.44% -19.64% +3.70%
75th Percentile £62,500 £57,813 £72,500
90th Percentile £72,250 £58,375 £75,000
Nottinghamshire median annual salary £42,500 £57,500 £70,000
% change year-on-year -26.09% -17.86% +7.69%

All Process and Methodology Skills
Nottingham

Containerisation falls under the Processes and Methodologies category. For comparison with the information above, the following table provides summary statistics for all permanent job vacancies requiring process or methodology skills in Nottingham.

Permanent vacancies with a requirement for process or methodology skills 541 224 759
As % of all permanent jobs advertised in Nottingham 89.72% 89.24% 96.08%
Number of salaries quoted 275 189 559
10th Percentile £32,000 £32,700 £36,250
25th Percentile £40,250 £43,750 £44,250
Median annual salary (50th Percentile) £55,000 £55,000 £55,000
Median % change year-on-year - - +10.00%
75th Percentile £70,000 £68,750 £71,250
90th Percentile £84,500 £80,250 £82,500
Nottinghamshire median annual salary £54,000 £55,000 £55,000
% change year-on-year -1.82% - +10.00%

Containerisation
Job Vacancy Trend in Nottingham

Job postings citing Containerisation as a proportion of all IT jobs advertised in Nottingham.
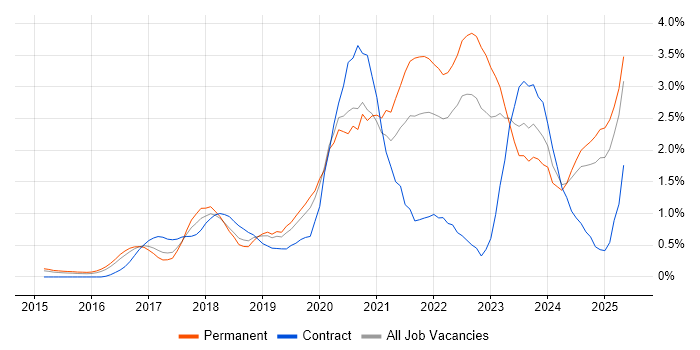
Job vacancy trend for Containerisation in Nottingham

Containerisation
Salary Trend in Nottingham

3-month moving average salary quoted in jobs citing Containerisation in Nottingham.

Salary trend for Containerisation in Nottingham

Containerisation
Salary Histogram in Nottingham

Salary distribution for jobs citing Containerisation in Nottingham over the 6 months to 12 December 2024.

Salary histogram for Containerisation in Nottingham

Containerisation
Co-occurring Skills and Capabilities in Nottingham by Category

The follow tables expand on the table above by listing co-occurrences grouped by category. The same employment type, locality and period is covered with up to 20 co-occurrences shown in each of the following categories:

Cloud Services
1 12 (100.00%) Azure
2 6 (50.00%) AWS
3 5 (41.67%) Azure Monitor
3 5 (41.67%) Entra ID
4 3 (25.00%) Amazon EKS
4 3 (25.00%) Amazon EventBridge
4 3 (25.00%) Amazon S3
4 3 (25.00%) AWS CodeBuild
4 3 (25.00%) AWS CodePipeline
4 3 (25.00%) Cloud Computing
4 3 (25.00%) CloudFront
4 3 (25.00%) SaaS
4 3 (25.00%) Virtual Private Cloud
Database & Business Intelligence
1 3 (25.00%) NoSQL
1 3 (25.00%) PostgreSQL
Development Applications
1 3 (25.00%) Android Studio
1 3 (25.00%) Eclipse
1 3 (25.00%) Git
1 3 (25.00%) IntelliJ
1 3 (25.00%) Jasmine
1 3 (25.00%) JUnit
1 3 (25.00%) Karma Test Runner
1 3 (25.00%) Mockito
1 3 (25.00%) Protractor
1 3 (25.00%) Subversion
1 3 (25.00%) Visual Studio Code
General
1 5 (41.67%) Law
1 5 (41.67%) Social Skills
2 1 (8.33%) Finance
Job Titles
1 6 (50.00%) Developer
2 5 (41.67%) Azure Engineer
3 3 (25.00%) Full-Stack Developer
3 3 (25.00%) IT Engineer
3 3 (25.00%) Java Developer
3 3 (25.00%) Senior
3 3 (25.00%) Senior Developer
3 3 (25.00%) Senior Full-Stack Developer
4 2 (16.67%) Azure Infrastructure Engineer
4 2 (16.67%) Backend Developer
4 2 (16.67%) Infrastructure Engineer
4 2 (16.67%) SaaS Developer
5 1 (8.33%) Head of Architecture
5 1 (8.33%) Java Software Developer
Libraries, Frameworks & Software Standards
1 6 (50.00%) React
2 5 (41.67%) Loki
3 3 (25.00%) Ajax
3 3 (25.00%) AngularJS
3 3 (25.00%) CSS
3 3 (25.00%) GraphQL
3 3 (25.00%) Hibernate
3 3 (25.00%) HTML
3 3 (25.00%) JPA
3 3 (25.00%) Node.js
3 3 (25.00%) RabbitMQ
3 3 (25.00%) React Native
3 3 (25.00%) Redux
3 3 (25.00%) REST
3 3 (25.00%) Web Services
3 3 (25.00%) YAML
Miscellaneous
1 3 (25.00%) Algorithms
Operating Systems
1 5 (41.67%) VMS
2 3 (25.00%) Android
2 3 (25.00%) Linux
Processes & Methodologies
1 6 (50.00%) Infrastructure as Code
1 6 (50.00%) Microservices
2 5 (41.67%) Cloud Security
2 5 (41.67%) Critical Thinking
2 5 (41.67%) Fault Analysis
2 5 (41.67%) ITIL
2 5 (41.67%) Load Balancing
2 5 (41.67%) Network Virtualisation
2 5 (41.67%) Observability
2 5 (41.67%) Performance Monitoring
2 5 (41.67%) RBAC
3 4 (33.33%) DevOps
4 3 (25.00%) Agile
4 3 (25.00%) API Management
4 3 (25.00%) Full-Stack Development
4 3 (25.00%) Problem-Solving
4 3 (25.00%) Unit Testing
5 2 (16.67%) Infrastructure Engineering
6 1 (8.33%) Architecture Governance
6 1 (8.33%) Roadmaps
Programming Languages
1 3 (25.00%) Java
1 3 (25.00%) JavaScript
1 3 (25.00%) SQL
Qualifications
1 5 (41.67%) Azure Certification
1 5 (41.67%) Degree
1 5 (41.67%) ITIL Foundation Certificate
1 5 (41.67%) Microsoft Certification
Quality Assurance & Compliance
1 5 (41.67%) ISO 9001
1 5 (41.67%) ISO/IEC 27001
2 3 (25.00%) QA
System Software
1 6 (50.00%) Docker
2 5 (41.67%) Active Directory
Systems Management
1 8 (66.67%) Kubernetes
2 5 (41.67%) Prometheus
3 3 (25.00%) Terraform
Vendors
1 5 (41.67%) Microsoft
2 3 (25.00%) IBM