Azure Jobs in Oxfordshire

Microsoft Azure
South East > Oxfordshire

The following table provides summary statistics for permanent job vacancies advertised in Oxfordshire with a requirement for Azure skills. Included is a benchmarking guide to the salaries offered in vacancies that have cited Azure over the 6 months to 3 May 2024 with a comparison to the same period in the previous 2 years.

6 months to
3 May 2024
Same period 2023 Same period 2022
Rank 6 5 13
Rank change year-on-year -1 +8 -8
Permanent jobs citing Azure 248 252 227
As % of all permanent jobs advertised in Oxfordshire 14.74% 15.98% 14.58%
As % of the Cloud Services category 44.13% 48.65% 40.11%
Number of salaries quoted 202 189 157
10th Percentile £36,750 £30,750 £31,250
25th Percentile £43,239 £41,250 £38,750
Median annual salary (50th Percentile) £52,500 £55,000 £52,500
Median % change year-on-year -4.55% +4.76% +5.00%
75th Percentile £64,750 £72,500 £68,750
90th Percentile £77,375 £77,500 £80,000
South East median annual salary £54,000 £57,500 £58,000
% change year-on-year -6.09% -0.86% +5.45%

All Cloud Skills
Oxfordshire

Azure is in the Cloud Services category. The following table is for comparison with the above and provides summary statistics for all permanent job vacancies advertised in Oxfordshire with a requirement for cloud computing skills.

Permanent vacancies with a requirement for cloud computing skills 562 518 566
As % of all permanent jobs advertised in Oxfordshire 33.39% 32.85% 36.35%
Number of salaries quoted 477 376 416
10th Percentile £31,000 £26,250 £31,250
25th Percentile £37,500 £35,000 £41,250
Median annual salary (50th Percentile) £47,500 £53,000 £61,250
Median % change year-on-year -10.38% -13.47% +22.50%
75th Percentile £62,500 £71,500 £75,000
90th Percentile £72,500 £83,125 £90,000
South East median annual salary £50,000 £55,000 £55,000
% change year-on-year -9.09% - +2.80%

Azure
Job Vacancy Trend in Oxfordshire

Job postings citing Azure as a proportion of all IT jobs advertised in Oxfordshire.
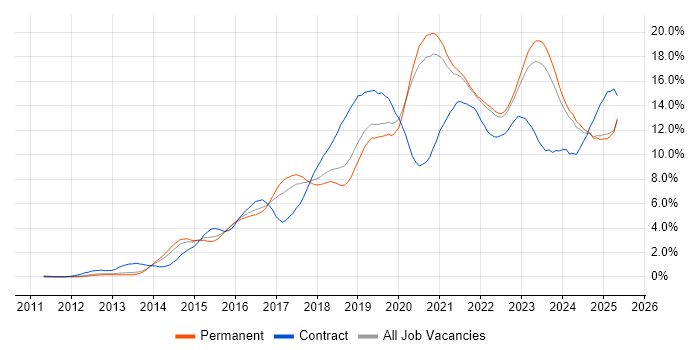
Job vacancy trend for Azure in Oxfordshire

Azure
Salary Trend in Oxfordshire

3-month moving average salary quoted in jobs citing Azure in Oxfordshire.

Salary trend for Azure in Oxfordshire

Azure
Salary Histogram in Oxfordshire

Salary distribution for jobs citing Azure in Oxfordshire over the 6 months to 3 May 2024.

Salary histogram for Azure in Oxfordshire

Azure
Job Locations in Oxfordshire

The table below looks at the demand and provides a guide to the median salaries quoted in IT jobs citing Azure within the Oxfordshire region over the 6 months to 3 May 2024. The 'Rank Change' column provides an indication of the change in demand within each location based on the same 6 month period last year.

Location Rank Change
on Same Period
Last Year
Matching
Permanent
IT Job Ads
Median Salary
Past 6 Months
Median Salary
% Change
on Same Period
Last Year
Live
Jobs
Oxford +1 91 £47,500 -5.00% 9
Abingdon +6 22 £56,250 -19.64% 4
Banbury - 21 £47,500 - 1
Witney -4 19 £60,000 - 3
Bicester -3 10 £40,000 -5.88% 2
Kidlington - 8 £46,560 -
Wallingford -6 7 £50,000 +33.33%
Thame +2 6 £47,500 -42.42% 1
Wantage +9 5 £60,000 - 1
Azure
South East

Azure
Co-occurring Skills and Capabilities in Oxfordshire by Category

The follow tables expand on the table above by listing co-occurrences grouped by category. The same employment type, locality and period is covered with up to 20 co-occurrences shown in each of the following categories:

Application Platforms
1 22 (8.87%) Microsoft Exchange
2 20 (8.06%) SharePoint
3 18 (7.26%) CMS
3 18 (7.26%) Headless CMS
3 18 (7.26%) Kentico
4 13 (5.24%) IIS
4 13 (5.24%) Sitecore CMS
4 13 (5.24%) Umbraco
5 12 (4.84%) OpenStack
6 4 (1.61%) Confluence
7 2 (0.81%) nginx
8 1 (0.40%) Apache
8 1 (0.40%) Apache Spark
Applications
1 2 (0.81%) Microsoft Office
1 2 (0.81%) Microsoft Project
1 2 (0.81%) MS Visio
2 1 (0.40%) Microsoft Excel
Business Applications
1 2 (0.81%) Unit4 Business World
2 1 (0.40%) Sage X3
2 1 (0.40%) SAP PLM
2 1 (0.40%) Teamcenter
Cloud Services
1 79 (31.85%) Microsoft 365
2 75 (30.24%) AWS
3 60 (24.19%) Azure DevOps
4 32 (12.90%) Power Platform
5 30 (12.10%) Entra ID
6 29 (11.69%) GCP
7 13 (5.24%) Dynamics 365
7 13 (5.24%) Kontent
7 13 (5.24%) SaaS
7 13 (5.24%) WhatsApp
8 12 (4.84%) PowerApps
9 7 (2.82%) GitHub
10 6 (2.42%) Azure Storage
10 6 (2.42%) IaaS
11 5 (2.02%) Cloud Computing
11 5 (2.02%) PaaS
11 5 (2.02%) Snowflake
12 4 (1.61%) Azure Data Factory
12 4 (1.61%) Power Automate
13 3 (1.21%) Azure Synapse Analytics
Communications & Networking
1 24 (9.68%) Firewall
2 21 (8.47%) DNS
3 19 (7.66%) DHCP
4 17 (6.85%) WAN
5 13 (5.24%) LAN
6 12 (4.84%) TCP/IP
7 11 (4.44%) SAN
8 7 (2.82%) Intranet
8 7 (2.82%) NAS
8 7 (2.82%) VLAN
8 7 (2.82%) VPN
9 5 (2.02%) SD-WAN
10 4 (1.61%) Wi-Fi
10 4 (1.61%) Wireless
11 3 (1.21%) Kerberos
11 3 (1.21%) WLAN
12 2 (0.81%) BGP
12 2 (0.81%) Internet
12 2 (0.81%) MPLS
12 2 (0.81%) OSPF
Database & Business Intelligence
1 34 (13.71%) Data Warehouse
2 31 (12.50%) SQL Server
3 24 (9.68%) BigQuery
3 24 (9.68%) Looker
4 11 (4.44%) MySQL
4 11 (4.44%) Power BI
5 9 (3.63%) Data Lake
6 8 (3.23%) Azure SQL Database
7 6 (2.42%) InfluxDB
7 6 (2.42%) MariaDB
7 6 (2.42%) PostgreSQL
8 4 (1.61%) SQL Server Integration Services
9 3 (1.21%) NoSQL
10 2 (0.81%) Elasticsearch
10 2 (0.81%) SQL Server Reporting Services
11 1 (0.40%) Amazon RDS
Development Applications
1 20 (8.06%) Git
2 14 (5.65%) Jenkins
3 13 (5.24%) JIRA
4 5 (2.02%) GitLab
4 5 (2.02%) MSTest
4 5 (2.02%) NUnit
5 4 (1.61%) Visual Studio
6 2 (0.81%) Bitbucket
6 2 (0.81%) Team Foundation Server
7 1 (0.40%) Maven
General
1 74 (29.84%) Social Skills
2 41 (16.53%) Analytical Skills
3 28 (11.29%) Public Sector
4 22 (8.87%) Finance
5 16 (6.45%) Billing
6 13 (5.24%) Retail
7 10 (4.03%) Presentation Skills
8 8 (3.23%) Legal
8 8 (3.23%) Pharmaceutical
9 7 (2.82%) Manufacturing
10 5 (2.02%) Games
10 5 (2.02%) Law
11 3 (1.21%) Aerospace
11 3 (1.21%) Marketing
11 3 (1.21%) Organisational Skills
12 2 (0.81%) Tech for Good
13 1 (0.40%) Inclusion and Diversity
13 1 (0.40%) Influencing Skills
13 1 (0.40%) Telecoms
Job Titles
1 59 (23.79%) Developer
2 48 (19.35%) Senior
3 34 (13.71%) .NET Developer
4 32 (12.90%) Senior Developer
5 30 (12.10%) Architect
6 21 (8.47%) Azure Engineer
7 20 (8.06%) Infrastructure Engineer
7 20 (8.06%) Lead
7 20 (8.06%) Senior .NET Developer
8 19 (7.66%) Full Stack Developer
9 17 (6.85%) C# .NET Developer
9 17 (6.85%) C# Developer
10 16 (6.45%) ASP.NET Developer
10 16 (6.45%) C# ASP.NET Developer
10 16 (6.45%) Data Manager
10 16 (6.45%) Engineering Manager
11 15 (6.05%) 3rd Line Support
12 14 (5.65%) IT Support
12 14 (5.65%) Senior C# .NET Developer
12 14 (5.65%) Senior C# Developer
Libraries, Frameworks & Software Standards
1 56 (22.58%) .NET
2 38 (15.32%) React
3 35 (14.11%) ASP.NET
4 33 (13.31%) .NET Core
5 28 (11.29%) .NET Framework
6 23 (9.27%) ASP.NET MVC
7 18 (7.26%) Next.js
8 16 (6.45%) HTML
8 16 (6.45%) RESTful
9 14 (5.65%) AngularJS
10 13 (5.24%) CSS
10 13 (5.24%) Entity Framework
11 7 (2.82%) ASP.NET Web API
11 7 (2.82%) Twitter Bootstrap
12 6 (2.42%) Blazor
13 5 (2.02%) ADO.NET
13 5 (2.02%) Dapper ORM
13 5 (2.02%) Nuxt
13 5 (2.02%) OAuth
14 4 (1.61%) Spring
Miscellaneous
1 27 (10.89%) Self-Motivation
2 22 (8.87%) Product Ownership
3 10 (4.03%) Security Posture
4 9 (3.63%) PKI
5 8 (3.23%) BBC
5 8 (3.23%) Social Media
6 7 (2.82%) Analytical Mindset
6 7 (2.82%) Biopharmaceutical
6 7 (2.82%) Data Centre
7 6 (2.42%) Cloud Native
7 6 (2.42%) Driving Licence
7 6 (2.42%) Greenfield Project
7 6 (2.42%) Life Science
8 5 (2.02%) Cyber Threat
8 5 (2.02%) Onboarding
9 4 (1.61%) Private Cloud
10 3 (1.21%) EMC VNX
11 2 (0.81%) iPhone
11 2 (0.81%) Public Cloud
11 2 (0.81%) Video Conferencing
Operating Systems
1 50 (20.16%) Windows
2 33 (13.31%) Linux
3 24 (9.68%) Windows Server
4 12 (4.84%) Windows Server 2016
4 12 (4.84%) Windows Server 2019
5 11 (4.44%) Windows 10
6 9 (3.63%) CentOS
7 8 (3.23%) Red Hat Enterprise Linux
8 7 (2.82%) Windows Server 2012
9 5 (2.02%) Android
10 4 (1.61%) Apple iOS
10 4 (1.61%) Mac OS X
10 4 (1.61%) Windows 8
10 4 (1.61%) Windows XP
11 3 (1.21%) Rocky
11 3 (1.21%) Ubuntu
12 2 (0.81%) Mac OS
12 2 (0.81%) VMS
12 2 (0.81%) Windows Server 2003
13 1 (0.40%) Windows Server 2008
Processes & Methodologies
1 81 (32.66%) DevOps
2 60 (24.19%) Problem-Solving
3 55 (22.18%) Agile
4 45 (18.15%) CI/CD
5 40 (16.13%) Full Stack Development
6 33 (13.31%) MVC
7 32 (12.90%) Data Modelling
8 30 (12.10%) Data Engineering
9 28 (11.29%) ETL
9 28 (11.29%) Infrastructure Engineering
9 28 (11.29%) Scrum
10 27 (10.89%) Project Management
11 24 (9.68%) Artificial Intelligence
11 24 (9.68%) ERP
11 24 (9.68%) Platform Engineering
12 23 (9.27%) Mentoring
13 22 (8.87%) Deployment Automation
14 20 (8.06%) E-Commerce
14 20 (8.06%) Technical Leadership
15 19 (7.66%) Product Backlog
Programming Languages
1 54 (21.77%) C#
2 52 (20.97%) JavaScript
3 34 (13.71%) Python
4 27 (10.89%) SQL
5 13 (5.24%) TypeScript
6 12 (4.84%) Bash
7 8 (3.23%) Java
8 6 (2.42%) Ruby
8 6 (2.42%) T-SQL
9 5 (2.02%) Perl
10 4 (1.61%) PowerShell
11 1 (0.40%) C
11 1 (0.40%) Go
11 1 (0.40%) Korn
11 1 (0.40%) Kusto Query Language
11 1 (0.40%) PHP
11 1 (0.40%) VBA
Qualifications
1 31 (12.50%) Degree
2 17 (6.85%) Cisco Certification
2 17 (6.85%) Security Cleared
3 16 (6.45%) Microsoft Certification
4 9 (3.63%) (ISC)2 CCSP
4 9 (3.63%) CCSK
4 9 (3.63%) CCSP
4 9 (3.63%) CISSP
4 9 (3.63%) MCP
5 8 (3.23%) Azure Certification
5 8 (3.23%) CCNA
6 6 (2.42%) Computer Science Degree
6 6 (2.42%) MCSE
7 5 (2.02%) SC Cleared
8 2 (0.81%) Master's Degree
9 1 (0.40%) BPSS Clearance
9 1 (0.40%) DBS Check
9 1 (0.40%) JNCIA
9 1 (0.40%) PhD
Quality Assurance & Compliance
1 18 (7.26%) QA
2 17 (6.85%) GDPR
3 11 (4.44%) Cyber Essentials
4 9 (3.63%) ISO/IEC 27001
4 9 (3.63%) ISO/IEC 27002 (supersedes ISO/IEC 17799)
4 9 (3.63%) NIST
5 8 (3.23%) Data Quality
6 7 (2.82%) SLA
System Software
1 44 (17.74%) Active Directory
2 22 (8.87%) VMware Infrastructure
3 20 (8.06%) Hyper-V
4 13 (5.24%) Docker
5 6 (2.42%) Citrix Hypervisor
6 5 (2.02%) Virtual Desktop
7 3 (1.21%) Virtual Machines
7 3 (1.21%) VMware ESXi
7 3 (1.21%) XenApp
7 3 (1.21%) XenDesktop
8 2 (0.81%) Firmware
Systems Management
1 19 (7.66%) Microsoft Intune
2 18 (7.26%) Terraform
3 14 (5.65%) Kubernetes
4 9 (3.63%) Ansible
5 8 (3.23%) SCCM
6 7 (2.82%) Active Directory Federation Services
7 5 (2.02%) Puppet
7 5 (2.02%) Red Hat Spacewalk
8 3 (1.21%) EMC NetWorker
8 3 (1.21%) vCenter Server
9 2 (0.81%) Nagios
10 1 (0.40%) Grafana
10 1 (0.40%) Icinga
10 1 (0.40%) PaperCut
10 1 (0.40%) Pingdom
10 1 (0.40%) WSUS
10 1 (0.40%) ZABBIX
10 1 (0.40%) ZENworks
Vendors
1 117 (47.18%) Microsoft
2 39 (15.73%) Google
3 30 (12.10%) VMware
4 13 (5.24%) Cisco
4 13 (5.24%) Optimizely
4 13 (5.24%) Sitecore
5 10 (4.03%) Apple
6 9 (3.63%) Citrix
7 8 (3.23%) Facebook
7 8 (3.23%) Fortinet
7 8 (3.23%) Sony
7 8 (3.23%) Yahoo!
8 7 (2.82%) Juniper
8 7 (2.82%) SAP
8 7 (2.82%) Veeam
9 6 (2.42%) Aruba
9 6 (2.42%) HP
9 6 (2.42%) Meraki
9 6 (2.42%) Sophos
9 6 (2.42%) WatchGuard