Local Government Jobs in Stevenage

Local Government (Local Authority, Local Council)
Hertfordshire > Stevenage

The table below looks at the prevalence of the term Local Government in permanent job vacancies in Stevenage. Included is a benchmarking guide to the salaries offered in vacancies that cited Local Government over the 6 months leading up to 29 May 2025, comparing them to the same period in the previous two years.

6 months to
29 May 2025
Same period 2024 Same period 2023
Rank 8 - -
Rank change year-on-year - - -
Permanent jobs citing Local Government 17 0 0
As % of all permanent jobs advertised in Stevenage 17.17% - -
As % of the General category 25.37% - -
Number of salaries quoted 17 0 0
10th Percentile £39,750 - -
25th Percentile £40,000 - -
Median annual salary (50th Percentile) £42,000 - -
75th Percentile £42,889 - -
90th Percentile £42,933 - -
Hertfordshire median annual salary £42,000 £47,500 £33,500
% change year-on-year -11.58% +41.79% -46.67%

All General Skills
Stevenage

Local Government falls under the General Skills category. For comparison with the information above, the following table provides summary statistics for all permanent job vacancies requiring common skills in Stevenage.

Permanent vacancies with a requirement for common skills 67 212 183
As % of all permanent jobs advertised in Stevenage 67.68% 45.99% 69.06%
Number of salaries quoted 61 168 101
10th Percentile £39,750 £34,833 £22,500
25th Percentile £41,280 £46,250 £32,500
Median annual salary (50th Percentile) £55,000 £55,000 £55,000
Median % change year-on-year - - +15.79%
75th Percentile £67,500 £65,313 £63,750
90th Percentile £73,250 £71,250 £67,500
Hertfordshire median annual salary £50,967 £50,000 £57,500
% change year-on-year +1.93% -13.04% +15.00%

Local Government
Job Vacancy Trend in Stevenage

Job postings citing Local Government as a proportion of all IT jobs advertised in Stevenage.
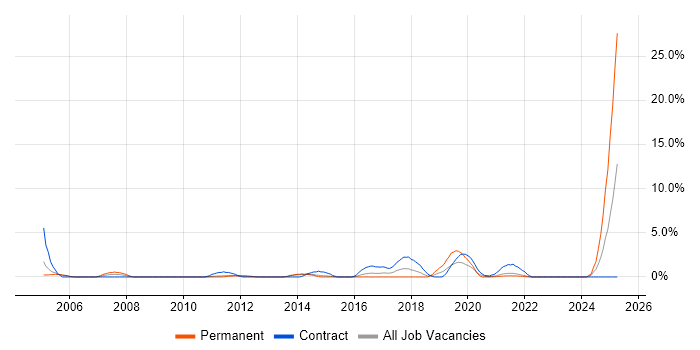
Job vacancy trend for Local Government in Stevenage

Local Government
Salary Trend in Stevenage

3-month moving average salary quoted in jobs citing Local Government in Stevenage.

Salary trend for Local Government in Stevenage

Local Government
Co-occurring Skills and Capabilities in Stevenage by Category

The follow tables expand on the table above by listing co-occurrences grouped by category. The same employment type, locality and period is covered with up to 20 co-occurrences shown in each of the following categories:

Application Platforms
1 9 (52.94%) SharePoint
2 7 (41.18%) IIS
3 2 (11.76%) Microsoft Exchange
Cloud Services
1 10 (58.82%) Microsoft 365
2 7 (41.18%) Power Platform
3 3 (17.65%) Azure
4 2 (11.76%) Entra ID
5 1 (5.88%) SaaS
Communications & Networking
1 7 (41.18%) FTP
2 4 (23.53%) Firewall
3 3 (17.65%) BGP
3 3 (17.65%) EIGRP
3 3 (17.65%) OSPF
3 3 (17.65%) SD-WAN
3 3 (17.65%) Spanning Tree
3 3 (17.65%) Unified Communications
3 3 (17.65%) VLAN
3 3 (17.65%) VoIP
3 3 (17.65%) WAN
3 3 (17.65%) Wi-Fi
3 3 (17.65%) Wireshark
4 1 (5.88%) H.323
4 1 (5.88%) RTP
Database & Business Intelligence
1 7 (41.18%) Power BI
1 7 (41.18%) SQL Server
Development Applications
1 7 (41.18%) SQL Server Management Studio (SSMS)
General
1 9 (52.94%) Social Skills
2 4 (23.53%) Analytical Skills
Job Titles
1 17 (100.00%) Senior
2 7 (41.18%) Applications Engineer
2 7 (41.18%) Applications Support
2 7 (41.18%) Applications Support Engineer
2 7 (41.18%) Senior Applications Engineer
2 7 (41.18%) Senior Applications Support
2 7 (41.18%) Senior Support Engineer
2 7 (41.18%) Support Engineer
3 4 (23.53%) Cybersecurity Engineer
3 4 (23.53%) Security Engineer
3 4 (23.53%) Senior Security Engineer
4 3 (17.65%) Senior Network Engineer
5 2 (11.76%) Network Engineer
6 1 (5.88%) Infrastructure Engineer
6 1 (5.88%) Senior Infrastructure Engineer
6 1 (5.88%) Senior Technical Engineer
6 1 (5.88%) Technical Engineer
6 1 (5.88%) Technical Infrastructure Engineer
6 1 (5.88%) Telephony Engineer
Operating Systems
1 7 (41.18%) Windows
1 7 (41.18%) Windows 10
Processes & Methodologies
1 15 (88.24%) ITIL
2 13 (76.47%) Problem-Solving
3 7 (41.18%) Business Intelligence
3 7 (41.18%) Cybersecurity
3 7 (41.18%) High Availability
4 4 (23.53%) Cyber Threat Intelligence
4 4 (23.53%) Incident Response
4 4 (23.53%) Risk Management
4 4 (23.53%) Threat Intelligence
4 4 (23.53%) Vulnerability Management
5 3 (17.65%) Network Monitoring
6 2 (11.76%) Change Management
6 2 (11.76%) Project Delivery
6 2 (11.76%) Project Management
6 2 (11.76%) Risk Assessment
7 1 (5.88%) Continuous Improvement
7 1 (5.88%) Infrastructure Engineering
7 1 (5.88%) Infrastructure Management
7 1 (5.88%) Service Delivery
Programming Languages
1 7 (41.18%) PowerShell
1 7 (41.18%) SQL
1 7 (41.18%) T-SQL
Qualifications
1 15 (88.24%) Degree
2 8 (47.06%) ITIL Foundation Certificate
3 4 (23.53%) CEH
3 4 (23.53%) CISM
3 4 (23.53%) CISSP
3 4 (23.53%) CREST Certified
3 4 (23.53%) GIAC
Quality Assurance & Compliance
1 4 (23.53%) Cyber Essentials
1 4 (23.53%) ISO/IEC 27001
1 4 (23.53%) NCSC
1 4 (23.53%) NIST
System Software
1 2 (11.76%) Active Directory
1 2 (11.76%) VMware Infrastructure
1 2 (11.76%) vSphere
2 1 (5.88%) Virtual Desktop
Systems Management
1 4 (23.53%) FortiGate
1 4 (23.53%) Nessus
2 2 (11.76%) Microsoft Intune
Vendors
1 14 (82.35%) Microsoft
2 4 (23.53%) Qualys
2 4 (23.53%) Tenable
3 3 (17.65%) Cisco
3 3 (17.65%) Fortinet
3 3 (17.65%) HP
3 3 (17.65%) SolarWinds
4 2 (11.76%) Pure Storage
4 2 (11.76%) VMware
5 1 (5.88%) Dell
5 1 (5.88%) Mitel
5 1 (5.88%) Red Box