Security Cleared Jobs in Wiltshire

Security Clearance
South West > Wiltshire

The following table provides summary statistics for permanent job vacancies advertised in Wiltshire with a requirement for Security Cleared qualifications. Included is a benchmarking guide to the salaries offered over the 6 months to 27 April 2024 with a comparison to the same period in the previous 2 years.

6 months to
27 Apr 2024
Same period 2023 Same period 2022
Rank 1 6 2
Rank change year-on-year +5 -4 +7
Permanent jobs citing Security Cleared 393 215 305
As % of all permanent jobs advertised in Wiltshire 31.02% 22.49% 28.24%
As % of the Qualifications category 73.18% 50.23% 65.59%
Number of salaries quoted 251 126 128
10th Percentile £37,000 £36,000 £31,050
25th Percentile £45,000 £42,656 £40,438
Median annual salary (50th Percentile) £51,000 £55,000 £57,500
Median % change year-on-year -7.27% -4.35% +6.48%
75th Percentile £63,750 £72,500 £75,000
90th Percentile £80,000 £82,500 £90,000
South West median annual salary £55,000 £55,000 £55,000
% change year-on-year - - +4.76%

All Academic and Professional Certifications
Wiltshire

Security Cleared is in the Academic Qualifications and Professional Certifications category. The following table is for comparison with the above and provides summary statistics for all permanent job vacancies advertised in Wiltshire with a requirement for academic qualifications or professional certifications.

Permanent vacancies requiring academic qualifications or professional certifications 537 428 465
As % of all permanent jobs advertised in Wiltshire 42.38% 44.77% 43.06%
Number of salaries quoted 356 218 245
10th Percentile £28,250 £33,750 £31,250
25th Percentile £41,250 £41,406 £37,500
Median annual salary (50th Percentile) £50,000 £53,519 £50,000
Median % change year-on-year -6.58% +7.04% -
75th Percentile £62,500 £69,688 £63,750
90th Percentile £80,000 £75,000 £77,500
South West median annual salary £52,500 £52,500 £50,000
% change year-on-year - +5.00% +3.09%

Security Cleared
Job Vacancy Trend in Wiltshire

Job postings citing Security Cleared as a proportion of all IT jobs advertised in Wiltshire.
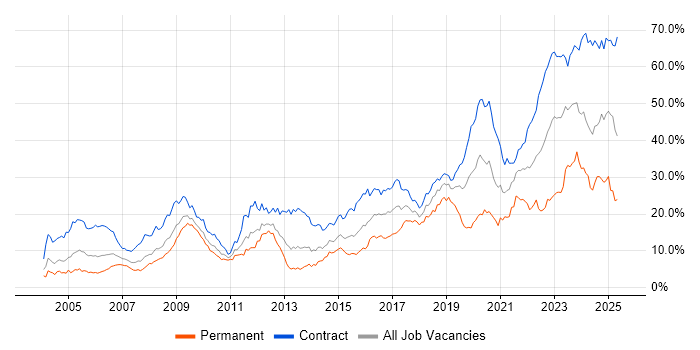
Job vacancy trend for Security Cleared in Wiltshire

Security Cleared
Salary Trend in Wiltshire

3-month moving average salary quoted in jobs citing Security Cleared in Wiltshire.

Salary trend for Security Cleared in Wiltshire

Security Cleared
Salary Histogram in Wiltshire

Salary distribution for jobs citing Security Cleared in Wiltshire over the 6 months to 27 April 2024.

Salary histogram for Security Cleared in Wiltshire

Security Cleared
Job Locations in Wiltshire

The table below looks at the demand and provides a guide to the median salaries quoted in IT jobs citing Security Cleared within the Wiltshire region over the 6 months to 27 April 2024. The 'Rank Change' column provides an indication of the change in demand within each location based on the same 6 month period last year.

Location Rank Change
on Same Period
Last Year
Matching
Permanent
IT Job Ads
Median Salary
Past 6 Months
Median Salary
% Change
on Same Period
Last Year
Live
Jobs
Corsham 0 116 £55,000 - 35
Chippenham +4 102 £50,000 -24.53% 3
Salisbury 0 77 £50,000 -9.09% 12
Swindon +19 47 £50,000 +5.26% 9
Tidworth - 2 £29,300 - 3
Warminster - 2 £43,500 -
Security Cleared
South West

Security Cleared
Co-occurring Skills and Capabilities in Wiltshire by Category

The follow tables expand on the table above by listing co-occurrences grouped by category. The same employment type, locality and period is covered with up to 20 co-occurrences shown in each of the following categories:

Application Platforms
1 25 (6.36%) SharePoint
2 8 (2.04%) SharePoint 2010
2 8 (2.04%) SharePoint 2013
3 3 (0.76%) ArcGIS
4 2 (0.51%) MS Project Server
4 2 (0.51%) Tomcat
4 2 (0.51%) WildFly
5 1 (0.25%) Apache
Applications
1 11 (2.80%) Simulink
2 10 (2.54%) Microsoft Office
3 3 (0.76%) Microsoft Project
Business Applications
1 17 (4.33%) Maximo
2 15 (3.82%) Sparx Enterprise Architect
Cloud Services
1 43 (10.94%) Azure
2 35 (8.91%) Microsoft 365
3 30 (7.63%) AWS
4 22 (5.60%) Azure DevOps
5 8 (2.04%) Power Platform
6 7 (1.78%) Cloud Computing
7 6 (1.53%) GCP
7 6 (1.53%) OCI
8 5 (1.27%) Nutanix
8 5 (1.27%) OpenShift
9 3 (0.76%) IaaS
9 3 (0.76%) PaaS
10 2 (0.51%) Azure Logic Apps
10 2 (0.51%) Azure Monitor
10 2 (0.51%) Azure Sentinel
10 2 (0.51%) Microsoft Purview
10 2 (0.51%) OneDrive
10 2 (0.51%) Power Automate
11 1 (0.25%) SaaS
Communications & Networking
1 50 (12.72%) Firewall
2 32 (8.14%) WAN
3 26 (6.62%) LAN
4 17 (4.33%) Software-Defined Networking
5 13 (3.31%) Cisco ASA
5 13 (3.31%) TCP/IP
6 11 (2.80%) Network Security
7 9 (2.29%) iSCSI
8 8 (2.04%) Fibre Channel
8 8 (2.04%) VSAN
9 7 (1.78%) Cisco IPT
10 6 (1.53%) SD-WAN
11 5 (1.27%) Cisco ISE
11 5 (1.27%) Cisco Wireless
11 5 (1.27%) NAS
11 5 (1.27%) SAN
11 5 (1.27%) Unified Communications
11 5 (1.27%) VXLAN
11 5 (1.27%) Wireless
11 5 (1.27%) WLAN
Database & Business Intelligence
1 18 (4.58%) SQL Server
2 14 (3.56%) GIS
3 13 (3.31%) Data Warehouse
4 11 (2.80%) Big Data
5 8 (2.04%) NoSQL
6 7 (1.78%) MySQL
7 3 (0.76%) Geospatial Data
8 2 (0.51%) OLTP
8 2 (0.51%) Relational Database
8 2 (0.51%) SQL Server Integration Services
Development Applications
1 11 (2.80%) Team Foundation Server
2 2 (0.51%) Git
2 2 (0.51%) GitLab
2 2 (0.51%) JIRA
2 2 (0.51%) MSI
3 1 (0.25%) Rational DOORS
3 1 (0.25%) Selenium
3 1 (0.25%) SpecFlow
General
1 92 (23.41%) Aerospace
2 55 (13.99%) Social Skills
3 37 (9.41%) Inclusion and Diversity
4 34 (8.65%) Public Sector
5 28 (7.12%) Military
6 24 (6.11%) Retail
7 19 (4.83%) Influencing Skills
7 19 (4.83%) Presentation Skills
8 9 (2.29%) Games
9 7 (1.78%) Finance
10 6 (1.53%) Organisational Skills
11 5 (1.27%) Electronics
11 5 (1.27%) Telecoms
12 2 (0.51%) Analytical Skills
12 2 (0.51%) Legal
12 2 (0.51%) Police
13 1 (0.25%) Law
13 1 (0.25%) Marketing
Job Titles
1 94 (23.92%) Architect
2 69 (17.56%) Senior
3 55 (13.99%) Infrastructure Engineer
4 44 (11.20%) Solutions Architect
5 36 (9.16%) Software Engineer
6 32 (8.14%) Network Engineer
7 27 (6.87%) Lead
8 26 (6.62%) Senior Network Engineer
9 24 (6.11%) Embedded Engineer
9 24 (6.11%) Embedded Software Engineer
10 20 (5.09%) Administrator
11 19 (4.83%) Consultant
12 18 (4.58%) IT Technician
13 17 (4.33%) Senior Wintel Engineer
13 17 (4.33%) Systems Administrator
13 17 (4.33%) Technical Architect
13 17 (4.33%) Wintel Engineer
14 15 (3.82%) IT Support Technician
14 15 (3.82%) Storage Engineer
14 15 (3.82%) Support Technician
Libraries, Frameworks & Software Standards
1 26 (6.62%) .NET
2 11 (2.80%) AngularJS
2 11 (2.80%) REST
3 9 (2.29%) Elastic Stack
4 7 (1.78%) ModSecurity
5 6 (1.53%) EJB
5 6 (1.53%) Software Packaging
6 4 (1.02%) JSON
6 4 (1.02%) RESTful
6 4 (1.02%) XML
7 3 (0.76%) .NET Core
7 3 (0.76%) .NET Framework
7 3 (0.76%) ASP.NET
7 3 (0.76%) ASP.NET MVC
7 3 (0.76%) Blazor
7 3 (0.76%) CSS
7 3 (0.76%) HTML
8 2 (0.51%) EDI
8 2 (0.51%) Microsoft Graph
8 2 (0.51%) SPFx
Miscellaneous
1 28 (7.12%) Driving Licence
2 25 (6.36%) Management Information System
3 22 (5.60%) PKI
4 21 (5.34%) Data Centre
5 17 (4.33%) Cloud Native
6 16 (4.07%) Hybrid Cloud
7 14 (3.56%) EMC VNX
7 14 (3.56%) Self-Motivation
8 13 (3.31%) Cyber Defence
9 12 (3.05%) Fat Client
9 12 (3.05%) Thin Client
10 10 (2.54%) Cyber Kill Chain
11 9 (2.29%) Security Operations Centre
12 8 (2.04%) Replication
12 8 (2.04%) Taxonomies
13 7 (1.78%) CCTV
13 7 (1.78%) Enterprise Storage
14 6 (1.53%) Cyber Threat
15 5 (1.27%) Public Cloud
16 4 (1.02%) Private Cloud
Operating Systems
1 95 (24.17%) Linux
2 83 (21.12%) Windows
3 32 (8.14%) Windows 10
4 28 (7.12%) Windows Server
5 24 (6.11%) Embedded Linux
6 12 (3.05%) Red Hat Enterprise Linux
7 10 (2.54%) Windows Server 2019
8 9 (2.29%) Windows Server 2016
9 8 (2.04%) CentOS
10 5 (1.27%) Windows 7
11 4 (1.02%) Windows Server 2012
Processes & Methodologies
1 97 (24.68%) Actionable Insight
2 87 (22.14%) Agile
3 64 (16.28%) ITIL
4 57 (14.50%) Cybersecurity
5 55 (13.99%) Collaborative Working
6 54 (13.74%) Infrastructure Engineering
7 47 (11.96%) Validation
8 46 (11.70%) DevOps
9 45 (11.45%) Incident Management
9 45 (11.45%) Migration
10 41 (10.43%) TOGAF
11 37 (9.41%) Problem-Solving
11 37 (9.41%) Roadmaps
12 36 (9.16%) ArchiMate
12 36 (9.16%) Software Engineering
13 34 (8.65%) Full Stack Development
14 33 (8.40%) Service Delivery
15 31 (7.89%) Service Management
16 29 (7.38%) Analytics
17 28 (7.12%) Information Security
Programming Languages
1 35 (8.91%) Python
2 33 (8.40%) PowerShell
3 28 (7.12%) Bash
4 24 (6.11%) C
4 24 (6.11%) Embedded C
4 24 (6.11%) Rust
5 12 (3.05%) MATLAB
6 11 (2.80%) JavaScript
7 8 (2.04%) TypeScript
8 4 (1.02%) C#
8 4 (1.02%) Lua
8 4 (1.02%) Perl
8 4 (1.02%) Ruby
8 4 (1.02%) SQL
8 4 (1.02%) Tcl
Qualifications
1 192 (48.85%) SC Cleared
2 154 (39.19%) DV Cleared
3 44 (11.20%) Degree
4 34 (8.65%) TOGAF Certification
5 21 (5.34%) BPSS Clearance
6 15 (3.82%) A+ Certification
7 13 (3.31%) Cisco Certification
8 12 (3.05%) CCNP
9 10 (2.54%) CESG Certified Professional
10 9 (2.29%) CCNA
10 9 (2.29%) CISSP
11 7 (1.78%) CISA
11 7 (1.78%) CISM
12 6 (1.53%) Computer Science Degree
13 5 (1.27%) RHCE
13 5 (1.27%) RHCSA
14 3 (0.76%) MCPD
14 3 (0.76%) Microsoft Certification
15 2 (0.51%) CCIE
15 2 (0.51%) DBS Check
Quality Assurance & Compliance
1 28 (7.12%) ISO/IEC 27001
2 12 (3.05%) NIST
3 8 (2.04%) NCSC
4 7 (1.78%) Cyber Essentials
4 7 (1.78%) Cyber Essentials PLUS
4 7 (1.78%) SLA
5 6 (1.53%) RMADS
6 5 (1.27%) GRC
6 5 (1.27%) ISO 9001
7 3 (0.76%) HMG Infosec
7 3 (0.76%) HMG Security Policy Framework
7 3 (0.76%) JSP 440
8 2 (0.51%) QA
9 1 (0.25%) Data Quality
9 1 (0.25%) ECSS
9 1 (0.25%) Government Security Classifications
System Software
1 70 (17.81%) VMware Infrastructure
2 61 (15.52%) Active Directory
3 36 (9.16%) VMware ESXi
4 23 (5.85%) Hyper-V
5 18 (4.58%) vSphere
6 15 (3.82%) VMware NSX
7 8 (2.04%) Microsoft App-V
8 6 (1.53%) Docker
9 3 (0.76%) BitLocker
9 3 (0.76%) Firmware
Systems Management
1 39 (9.92%) SCCM
2 29 (7.38%) Ansible
3 19 (4.83%) vCenter Server
4 14 (3.56%) EMC NetWorker
4 14 (3.56%) Nagios
5 9 (2.29%) Puppet
6 8 (2.04%) ZABBIX
7 6 (1.53%) Failover Clustering
7 6 (1.53%) Icinga
7 6 (1.53%) Kubernetes
8 5 (1.27%) Cisco Prime
8 5 (1.27%) Opsview
9 4 (1.02%) Progress Chef
9 4 (1.02%) vRealize
10 3 (0.76%) SCOM
11 2 (0.51%) Terraform
12 1 (0.25%) Microsoft Clustering
12 1 (0.25%) Microsoft Data Protection Manager
Vendors
1 105 (26.72%) Microsoft
2 81 (20.61%) VMware
3 38 (9.67%) Cisco
4 33 (8.40%) SolarWinds
5 15 (3.82%) Sparx
6 14 (3.56%) EMC
6 14 (3.56%) Veeam
7 11 (2.80%) Citrix
8 10 (2.54%) Red Hat
9 9 (2.29%) Brocade
9 9 (2.29%) Tanium
9 9 (2.29%) Tripwire
10 8 (2.04%) IBM
10 8 (2.04%) NetApp
10 8 (2.04%) Oracle
11 6 (1.53%) Google
12 5 (1.27%) Aruba
12 5 (1.27%) Meraki
12 5 (1.27%) ServiceNow
13 4 (1.02%) SaltStack