Security Cleared Jobs in the South West

Security Clearance
England > South West

The table below provides summary statistics for permanent job vacancies advertised in the South West with a requirement for Security Cleared qualifications. It includes a benchmarking guide to the salaries offered over the 6 months leading up to 18 July 2025, comparing them to the same period in the previous two years.

6 months to
18 Jul 2025
Same period 2024 Same period 2023
Rank 8 2 3
Rank change year-on-year -6 +1 +6
Permanent jobs citing Security Cleared 492 1,809 1,448
As % of all permanent jobs advertised in the South West 12.46% 18.63% 22.84%
As % of the Qualifications category 30.11% 57.01% 51.68%
Number of salaries quoted 303 1,206 696
10th Percentile £35,000 £35,000 £35,000
25th Percentile £47,500 £47,500 £43,750
Median annual salary (50th Percentile) £60,000 £57,500 £60,000
Median % change year-on-year +4.35% -4.17% +9.09%
75th Percentile £75,000 £70,250 £75,000
90th Percentile £95,000 £87,500 £85,000
England median annual salary £62,000 £57,500 £60,000
% change year-on-year +7.83% -4.17% +9.09%

All Academic and Professional Certifications
South West

Security Cleared falls under the Academic Qualifications and Professional Certifications category. For comparison with the information above, the following table provides summary statistics for all permanent job vacancies requiring academic qualifications or professional certifications in the South West.

Permanent vacancies requiring academic qualifications or professional certifications 1,634 3,173 2,802
As % of all permanent jobs advertised in the South West 41.39% 32.67% 44.20%
Number of salaries quoted 954 2,028 1,416
10th Percentile £29,538 £30,000 £30,932
25th Percentile £34,500 £41,438 £38,750
Median annual salary (50th Percentile) £51,058 £55,000 £55,000
Median % change year-on-year -7.17% - +10.00%
75th Percentile £63,409 £70,000 £72,296
90th Percentile £81,100 £82,500 £85,000
England median annual salary £55,000 £55,000 £60,000
% change year-on-year - -8.33% +9.09%

Security Cleared
Job Vacancy Trend in the South West

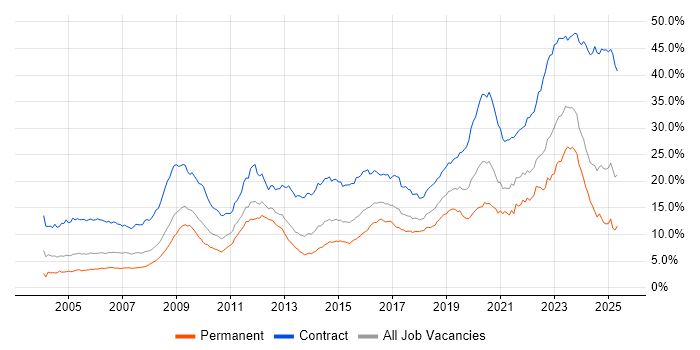
Job postings citing Security Cleared as a proportion of all IT jobs advertised in the South West.

Job vacancy trend for Security Cleared in the South West

Security Cleared
Salary Trend in the South West

3-month moving average salary quoted in jobs citing Security Cleared in the South West.

Salary trend for Security Cleared in the South West

Security Cleared
Salary Histogram in the South West

Salary distribution for jobs citing Security Cleared in the South West over the 6 months to 18 July 2025.

Salary histogram for Security Cleared in the South West

Security Cleared
Job Locations in the South West

The table below looks at the demand and provides a guide to the median salaries quoted in IT jobs citing Security Cleared within the South West region over the 6 months to 18 July 2025. The 'Rank Change' column provides an indication of the change in demand within each location based on the same 6 month period last year.

Location Rank Change
on Same Period
Last Year
Matching
Permanent
IT Job Ads
Median Salary
Past 6 Months
Median Salary
% Change
on Same Period
Last Year
Live
Jobs
Gloucestershire 0 187 £65,000 +13.04% 278
Bristol -15 105 £60,000 -7.69% 235
Wiltshire -1 104 £52,500 - 87
Dorset -14 31 £51,250 +20.59% 23
Cornwall +20 25 £31,000 +19.23% 2
Devon +15 17 £55,971 +35.83% 45
Somerset -24 14 £57,000 +87.59% 38
Security Cleared
England

Security Cleared
Co-occurring Skills and Capabilities in the South West by Category

The follow tables expand on the table above by listing co-occurrences grouped by category. The same employment type, locality and period is covered with up to 20 co-occurrences shown in each of the following categories:

Application Platforms
1 20 (4.07%) Jupyter
2 14 (2.85%) Microsoft Exchange
3 11 (2.24%) Confluence
4 8 (1.63%) SharePoint
5 4 (0.81%) Appian
6 3 (0.61%) ArcGIS
7 1 (0.20%) Apache Airflow
7 1 (0.20%) SharePoint Server
7 1 (0.20%) WordPress
Applications
1 23 (4.67%) Microsoft Office
2 5 (1.02%) Simulink
3 2 (0.41%) Microsoft Excel
3 2 (0.41%) Microsoft PowerPoint
3 2 (0.41%) Windchill
4 1 (0.20%) Adobe Creative Suite
4 1 (0.20%) AutoCAD
4 1 (0.20%) ProjectWise
4 1 (0.20%) Revit
Business Applications
1 2 (0.41%) Sparx Enterprise Architect
2 1 (0.20%) Primavera
Cloud Services
1 70 (14.23%) AWS
2 65 (13.21%) Azure
3 35 (7.11%) Microsoft 365
4 23 (4.67%) Entra ID
5 15 (3.05%) Serverless
6 10 (2.03%) Amazon S3
6 10 (2.03%) AWS Lambda
7 9 (1.83%) Amazon EC2
8 8 (1.63%) GCP
9 6 (1.22%) Azure Stack
10 5 (1.02%) Amazon ECS
11 4 (0.81%) AWS CloudFormation
11 4 (0.81%) GitHub
11 4 (0.81%) OCI
11 4 (0.81%) Power Platform
11 4 (0.81%) Virtual Private Cloud
12 3 (0.61%) Dynamics 365
13 2 (0.41%) Amazon EKS
13 2 (0.41%) Azure DevOps
13 2 (0.41%) Microsoft Purview
Communications & Networking
1 36 (7.32%) Firewall
2 31 (6.30%) Network Security
3 24 (4.88%) VPN
4 16 (3.25%) LAN
4 16 (3.25%) VSAT
4 16 (3.25%) WAN
5 13 (2.64%) DNS
6 9 (1.83%) DHCP
7 8 (1.63%) MPLS
7 8 (1.63%) Wireless
8 7 (1.42%) Wi-Fi
9 6 (1.22%) Cisco Firepower
9 6 (1.22%) LTE
9 6 (1.22%) Reverse Proxy
9 6 (1.22%) VPLS
10 5 (1.02%) 802.11
10 5 (1.02%) Cisco ASA
10 5 (1.02%) OSPF
10 5 (1.02%) SAN
10 5 (1.02%) TCP/IP
Database & Business Intelligence
1 40 (8.13%) Big Data
2 11 (2.24%) MongoDB
2 11 (2.24%) SQL Server
3 7 (1.42%) Elasticsearch
4 6 (1.22%) Amazon RDS
4 6 (1.22%) Relational Database
5 5 (1.02%) PostgreSQL
5 5 (1.02%) SAP Data Services
6 3 (0.61%) Data Warehouse
6 3 (0.61%) DynamoDB
6 3 (0.61%) NoSQL
6 3 (0.61%) Power BI
7 2 (0.41%) Data Lake
7 2 (0.41%) GIS
7 2 (0.41%) Redis
8 1 (0.20%) DB2
8 1 (0.20%) MySQL
8 1 (0.20%) Neo4j
8 1 (0.20%) Oracle Exadata
8 1 (0.20%) RDBMS
Development Applications
1 20 (4.07%) GitLab
2 15 (3.05%) JIRA
3 13 (2.64%) Git
4 6 (1.22%) Jenkins
4 6 (1.22%) Rational DOORS
5 4 (0.81%) Cypress.io
5 4 (0.81%) Rational Rhapsody
6 2 (0.41%) JUnit
6 2 (0.41%) SonarQube
7 1 (0.20%) Bitbucket
7 1 (0.20%) Cucumber
7 1 (0.20%) GDB
7 1 (0.20%) LabVIEW
7 1 (0.20%) Yeoman
General
1 137 (27.85%) Finance
2 99 (20.12%) Social Skills
3 60 (12.20%) Public Sector
4 56 (11.38%) Inclusion and Diversity
5 52 (10.57%) Analytical Skills
6 50 (10.16%) Manufacturing
7 46 (9.35%) Electronics
8 43 (8.74%) Telecoms
9 36 (7.32%) Marketing
10 30 (6.10%) Aerospace
11 14 (2.85%) Automotive
11 14 (2.85%) Back Office
11 14 (2.85%) Military
12 7 (1.42%) Law
13 6 (1.22%) Legal
13 6 (1.22%) Organisational Skills
13 6 (1.22%) Retail
14 5 (1.02%) Billing
14 5 (1.02%) Influencing Skills
14 5 (1.02%) Presentation Skills
Job Titles
1 53 (10.77%) Senior
2 49 (9.96%) Administrator
3 45 (9.15%) Systems Administrator
4 44 (8.94%) Lead
5 40 (8.13%) Data Scientist
6 38 (7.72%) Architect
6 38 (7.72%) Support Engineer
7 37 (7.52%) Developer
8 34 (6.91%) Consultant
8 34 (6.91%) Software Engineer
9 26 (5.28%) Technical Support
10 25 (5.08%) Technical Engineer
10 25 (5.08%) Technical Support Engineer
11 23 (4.67%) Systems Engineer
12 20 (4.07%) Cybersecurity Consultant
12 20 (4.07%) Desktop Support
12 20 (4.07%) Security Consultant
12 20 (4.07%) Senior Data Scientist
13 19 (3.86%) Network Engineer
14 17 (3.46%) Solutions Architect
Libraries, Frameworks & Software Standards
1 22 (4.47%) React
2 11 (2.24%) Spring Boot
3 9 (1.83%) AngularJS
3 9 (1.83%) RESTful
3 9 (1.83%) Spring
4 8 (1.63%) .NET
4 8 (1.63%) Kafka
4 8 (1.63%) Vue
5 7 (1.42%) HTML
6 5 (1.02%) 802.1X
6 5 (1.02%) Node.js
7 4 (0.81%) Android Jetpack
7 4 (0.81%) AWS CDK
7 4 (0.81%) Hibernate
7 4 (0.81%) Jetpack Compose
7 4 (0.81%) JSF
7 4 (0.81%) OkHttp
7 4 (0.81%) Retrofit
8 3 (0.61%) OAuth
8 3 (0.61%) REST
Miscellaneous
1 47 (9.55%) e-Learning
2 44 (8.94%) Algorithms
3 43 (8.74%) Cyberattack
4 18 (3.66%) Analytical Mindset
5 15 (3.05%) Data Centre
6 11 (2.24%) Hybrid Cloud
6 11 (2.24%) Onboarding
7 10 (2.03%) Cloud Native
7 10 (2.03%) Private Cloud
8 9 (1.83%) Security Posture
9 8 (1.63%) Management Information System
10 7 (1.42%) Driving Licence
10 7 (1.42%) Product Ownership
11 6 (1.22%) Cyber Threat
12 5 (1.02%) Cloud Security Posture
12 5 (1.02%) CMDB
12 5 (1.02%) Renewable Energy
12 5 (1.02%) Security Operations Centre
13 4 (0.81%) FPGA
13 4 (0.81%) VHDL
Operating Systems
1 89 (18.09%) Linux
2 64 (13.01%) Windows
3 35 (7.11%) Windows Server
4 16 (3.25%) Windows 10
5 9 (1.83%) Android
6 7 (1.42%) Unix
6 7 (1.42%) Windows Server 2019
7 6 (1.22%) Mac OS
7 6 (1.22%) Rocky
8 3 (0.61%) Red Hat Enterprise Linux
9 2 (0.41%) AIX
10 1 (0.20%) Apple iOS
10 1 (0.20%) Embedded Linux
10 1 (0.20%) Ubuntu
10 1 (0.20%) Windows 7
10 1 (0.20%) Windows Server 2016
Processes & Methodologies
1 104 (21.14%) Problem-Solving
2 79 (16.06%) Cybersecurity
3 77 (15.65%) Agile
4 70 (14.23%) Mentoring
4 70 (14.23%) Software Engineering
5 65 (13.21%) Mathematics
6 60 (12.20%) DevOps
7 57 (11.59%) Artificial Intelligence
8 54 (10.98%) Machine Learning
8 54 (10.98%) Statistics
9 52 (10.57%) Analytics
10 48 (9.76%) Continuous Improvement
11 47 (9.55%) Computer Science
11 47 (9.55%) Innovative Thinking
12 43 (8.74%) Data Science
13 42 (8.54%) CI/CD
13 42 (8.54%) Containerisation
13 42 (8.54%) Data Analysis
14 41 (8.33%) Visualisation
15 40 (8.13%) OpenUP
Programming Languages
1 74 (15.04%) Python
2 61 (12.40%) Java
3 50 (10.16%) JavaScript
4 18 (3.66%) C++
5 17 (3.46%) PowerShell
5 17 (3.46%) TypeScript
6 13 (2.64%) SQL
7 9 (1.83%) Bash
7 9 (1.83%) C
8 6 (1.22%) Rust
9 5 (1.02%) Go
9 5 (1.02%) Perl
10 4 (0.81%) Kotlin
10 4 (0.81%) MATLAB
10 4 (0.81%) PHP
11 3 (0.61%) C#
12 2 (0.41%) Ada
12 2 (0.41%) R
12 2 (0.41%) Shell Script
13 1 (0.20%) Tcl
Qualifications
1 271 (55.08%) SC Cleared
2 217 (44.11%) DV Cleared
3 115 (23.37%) Degree
4 60 (12.20%) Cisco Certification
5 36 (7.32%) CCNP
6 34 (6.91%) BPSS Clearance
6 34 (6.91%) CCNA
7 31 (6.30%) CISSP
8 25 (5.08%) CompTIA Security+
9 22 (4.47%) CEH
9 22 (4.47%) Computer Science Degree
10 20 (4.07%) Numerate Degree
11 19 (3.86%) RHCSA
12 16 (3.25%) AWS Certification
12 16 (3.25%) JNCIA
13 14 (2.85%) CTC Cleared
14 11 (2.24%) Azure Certification
15 8 (1.63%) CISM
16 7 (1.42%) Network+ Certification
17 5 (1.02%) GCSC
Quality Assurance & Compliance
1 26 (5.28%) NIST
2 24 (4.88%) ISO/IEC 27001
3 19 (3.86%) SLA
4 18 (3.66%) PCI DSS
5 9 (1.83%) Def Stans
6 7 (1.42%) GDPR
7 5 (1.02%) QA
8 4 (0.81%) ISO 9001
9 3 (0.61%) Accessibility
9 3 (0.61%) JSP 440
9 3 (0.61%) RMADS
10 2 (0.41%) Data Quality
10 2 (0.41%) GRC
10 2 (0.41%) HIPAA
10 2 (0.41%) NCSC
11 1 (0.20%) COBIT
11 1 (0.20%) DO-178B
11 1 (0.20%) IEC 61508
11 1 (0.20%) ISO 14001
11 1 (0.20%) ISO/IEC 20000
System Software
1 60 (12.20%) Docker
2 22 (4.47%) VMware Infrastructure
3 18 (3.66%) Active Directory
4 8 (1.63%) Hyper-V
5 4 (0.81%) VMware ESXi
6 2 (0.41%) Virtual Desktop
7 1 (0.20%) BitLocker
7 1 (0.20%) Microsoft App-V
7 1 (0.20%) Slurm Workload Manager
7 1 (0.20%) Virtual Machines
7 1 (0.20%) VMware NSX
7 1 (0.20%) vSphere
Systems Management
1 56 (11.38%) Kubernetes
2 27 (5.49%) Terraform
3 25 (5.08%) Ansible
4 6 (1.22%) Microsoft Intune
5 5 (1.02%) Kibana
6 3 (0.61%) Active Directory Federation Services
6 3 (0.61%) Puppet
7 2 (0.41%) Backup Exec
7 2 (0.41%) EMC NetWorker
7 2 (0.41%) FortiGate
7 2 (0.41%) Grafana
7 2 (0.41%) NetBackup
7 2 (0.41%) Progress Chef
7 2 (0.41%) Prometheus
7 2 (0.41%) SCCM
8 1 (0.20%) Nagios
8 1 (0.20%) Packer
Vendors
1 64 (13.01%) Cisco
2 49 (9.96%) Microsoft
3 33 (6.71%) SAP
4 31 (6.30%) VMware
5 21 (4.27%) Red Hat
6 15 (3.05%) Oracle
7 8 (1.63%) Fortinet
7 8 (1.63%) HP
8 7 (1.42%) Atlassian
9 6 (1.22%) Citrix
9 6 (1.22%) Dell
9 6 (1.22%) Freshdesk
9 6 (1.22%) IBM
9 6 (1.22%) Juniper
9 6 (1.22%) SolarWinds
10 5 (1.02%) Cognizant
10 5 (1.02%) Veeam
11 4 (0.81%) F5
11 4 (0.81%) Meraki
11 4 (0.81%) Samsung