Project Delivery Contracts in Glasgow

Project Delivery
Scotland > Glasgow

The table below provides summary statistics for contract job vacancies advertised in Glasgow requiring Project Delivery skills. It includes a benchmarking guide to the contractor rates offered in vacancies that cited Project Delivery over the 6 months leading up to 1 May 2025, comparing them to the same period in the previous two years.

6 months to
1 May 2025
Same period 2024 Same period 2023
Rank 26 32 24
Rank change year-on-year +6 -8 0
Contract jobs citing Project Delivery 61 54 74
As % of all contract jobs advertised in Glasgow 7.64% 6.16% 8.10%
As % of the Processes & Methodologies category 8.17% 6.70% 8.58%
Number of daily rates quoted 48 39 56
10th Percentile £302 £280 £353
25th Percentile £394 £423 £413
Median daily rate (50th Percentile) £449 £550 £500
Median % change year-on-year -18.45% +10.00% -
75th Percentile £525 £622 £578
90th Percentile £592 £702 £688
Scotland median daily rate £475 £513 £475
% change year-on-year -7.32% +7.89% -
Number of hourly rates quoted 0 8 0
Median hourly rate - £40.94 -
Scotland median hourly rate - £40.94 -

All Process and Methodology Skills
Glasgow

Project Delivery falls under the Processes and Methodologies category. For comparison with the information above, the following table provides summary statistics for all contract job vacancies requiring process or methodology skills in Glasgow.

Contract vacancies with a requirement for process or methodology skills 747 806 862
As % of all contract IT jobs advertised in Glasgow 93.61% 91.90% 94.31%
Number of daily rates quoted 478 515 629
10th Percentile £311 £280 £325
25th Percentile £393 £400 £410
Median daily rate (50th Percentile) £463 £475 £475
Median % change year-on-year -2.63% - +5.56%
75th Percentile £550 £588 £600
90th Percentile £603 £675 £701
Scotland median daily rate £463 £475 £475
% change year-on-year -2.63% - +2.15%
Number of hourly rates quoted 9 40 27
10th Percentile £16.18 £13.75 -
25th Percentile £16.75 £16.00 £10.63
Median hourly rate £19.83 £21.13 £13.50
Median % change year-on-year -6.14% +56.50% -66.24%
75th Percentile £65.00 £44.14 £35.00
90th Percentile £76.83 £63.75 £59.47
Scotland median hourly rate £21.59 £19.34 £17.72
% change year-on-year +11.66% +9.11% -55.69%

Project Delivery
Job Vacancy Trend in Glasgow

Job postings citing Project Delivery as a proportion of all IT jobs advertised in Glasgow.
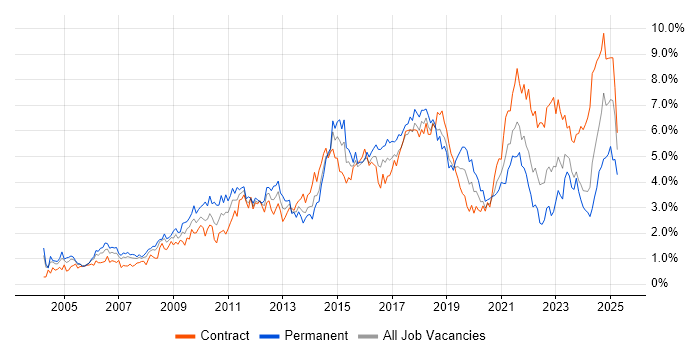
Job vacancy trend for Project Delivery in Glasgow

Project Delivery
Contractor Daily Rate Trend in Glasgow

3-month moving average daily rate quoted in jobs citing Project Delivery in Glasgow.

Daily rate trend for Project Delivery in Glasgow

Project Delivery
Daily Rate Histogram in Glasgow

Daily rate distribution for jobs citing Project Delivery in Glasgow over the 6 months to 1 May 2025.

Daily rate histogram for Project Delivery in Glasgow

Project Delivery
Contractor Hourly Rate Trend in Glasgow

3-month moving average hourly rates quoted in jobs citing Project Delivery in Glasgow.

Hourly rate trend for Project Delivery in Glasgow

Project Delivery
Co-occurring Skills and Capabilities in Glasgow by Category

The follow tables expand on the table above by listing co-occurrences grouped by category. The same employment type, locality and period is covered with up to 20 co-occurrences shown in each of the following categories:

Application Platforms
1 1 (1.64%) Confluence
1 1 (1.64%) JBoss
1 1 (1.64%) SharePoint
1 1 (1.64%) WebLogic
1 1 (1.64%) WebSphere
1 1 (1.64%) WebSphere Application Server
Applications
1 10 (16.39%) Microsoft Project
2 7 (11.48%) Microsoft Excel
3 6 (9.84%) Microsoft PowerPoint
4 2 (3.28%) Microsoft Office
5 1 (1.64%) MS Visio
Cloud Services
1 12 (19.67%) AWS
2 5 (8.20%) Azure
3 2 (3.28%) Asana
4 1 (1.64%) Azure DevOps
4 1 (1.64%) IaaS
4 1 (1.64%) Microsoft 365
Communications & Networking
1 1 (1.64%) Firewall
1 1 (1.64%) Intranet
1 1 (1.64%) LAN
1 1 (1.64%) SDH
1 1 (1.64%) WAN
Database & Business Intelligence
1 2 (3.28%) EDRMS
2 1 (1.64%) Data Lake
Development Applications
1 3 (4.92%) JIRA
General
1 32 (52.46%) Finance
2 15 (24.59%) Banking
2 15 (24.59%) Social Skills
3 10 (16.39%) Public Sector
4 7 (11.48%) Analytical Skills
5 4 (6.56%) Financial Institution
5 4 (6.56%) Organisational Skills
6 2 (3.28%) Influencing Skills
6 2 (3.28%) Local Government
6 2 (3.28%) Presentation Skills
6 2 (3.28%) Telecoms
7 1 (1.64%) Legal
7 1 (1.64%) Retail Banking
Job Titles
1 21 (34.43%) Project Manager
2 14 (22.95%) Developer
3 13 (21.31%) Java Developer
4 8 (13.11%) Senior
5 5 (8.20%) Analyst
5 5 (8.20%) Technical Manager
6 4 (6.56%) Technical Project Manager
7 3 (4.92%) Architect
7 3 (4.92%) Full-Stack Developer
7 3 (4.92%) Full-Stack Java Developer
7 3 (4.92%) PMO Analyst
7 3 (4.92%) React Developer
7 3 (4.92%) Senior Manager
7 3 (4.92%) Senior Project Manager
8 2 (3.28%) Delivery Manager
8 2 (3.28%) Infrastructure Manager
8 2 (3.28%) Junior Software Engineer
8 2 (3.28%) Lead
8 2 (3.28%) PMO Lead
8 2 (3.28%) Service Manager
Libraries, Frameworks & Software Standards
1 15 (24.59%) Spring
1 15 (24.59%) Spring Boot
2 3 (4.92%) Middleware
2 3 (4.92%) React
3 1 (1.64%) EntireX
3 1 (1.64%) IBM Integration Bus
3 1 (1.64%) J2EE
Miscellaneous
1 5 (8.20%) PMI
2 3 (4.92%) Management Information System
3 2 (3.28%) Product Ownership
4 1 (1.64%) Data Centre
4 1 (1.64%) Data Protection Act
4 1 (1.64%) Driving Licence
4 1 (1.64%) Mainframe
4 1 (1.64%) Mobile App
4 1 (1.64%) Operational Technology
4 1 (1.64%) SWIFT Messaging Network
4 1 (1.64%) Virtual Team
Operating Systems
1 3 (4.92%) Windows
2 1 (1.64%) Linux
2 1 (1.64%) Red Hat Enterprise Linux
2 1 (1.64%) Unix
Processes & Methodologies
1 20 (32.79%) Agile
1 20 (32.79%) Process Improvement
2 18 (29.51%) Project Management
3 15 (24.59%) CI/CD
4 11 (18.03%) Waterfall
5 10 (16.39%) Change Management
5 10 (16.39%) Stakeholder Management
5 10 (16.39%) Workshop Facilitation
6 8 (13.11%) Budget Management
6 8 (13.11%) Programme Management
7 7 (11.48%) Problem-Solving
7 7 (11.48%) Software Engineering
7 7 (11.48%) Stakeholder Engagement
8 6 (9.84%) PRINCE2
8 6 (9.84%) Risk Management
9 5 (8.20%) Asset Management
9 5 (8.20%) IT Asset Management
9 5 (8.20%) Project Planning
9 5 (8.20%) Resource Allocation
9 5 (8.20%) Time Management
Programming Languages
1 16 (26.23%) Java
Qualifications
1 6 (9.84%) Degree
1 6 (9.84%) PMI Certification
2 2 (3.28%) PMP
3 1 (1.64%) APMP
3 1 (1.64%) BPSS Clearance
3 1 (1.64%) Computer Science Degree
3 1 (1.64%) DBS Check
3 1 (1.64%) HNC
3 1 (1.64%) Master's Degree
3 1 (1.64%) PRINCE2 Practitioner
3 1 (1.64%) SC Cleared
3 1 (1.64%) Security Cleared
Quality Assurance & Compliance
1 8 (13.11%) PMO
2 1 (1.64%) QA
System Software
1 1 (1.64%) Virtual Desktop
1 1 (1.64%) Virtual Machines
1 1 (1.64%) VMware Infrastructure
Systems Management
1 15 (24.59%) Terraform
2 1 (1.64%) EMC NetWorker
Vendors
1 4 (6.56%) Microsoft
2 3 (4.92%) Pega
3 2 (3.28%) Cisco
3 2 (3.28%) IBM
4 1 (1.64%) Citrix
4 1 (1.64%) Dynatrace
4 1 (1.64%) Nokia
4 1 (1.64%) Openreach
4 1 (1.64%) Oracle
4 1 (1.64%) ServiceNow
4 1 (1.64%) Software AG
4 1 (1.64%) Spotify
4 1 (1.64%) VMware
4 1 (1.64%) webMethods